Preview image. Unlock full-res
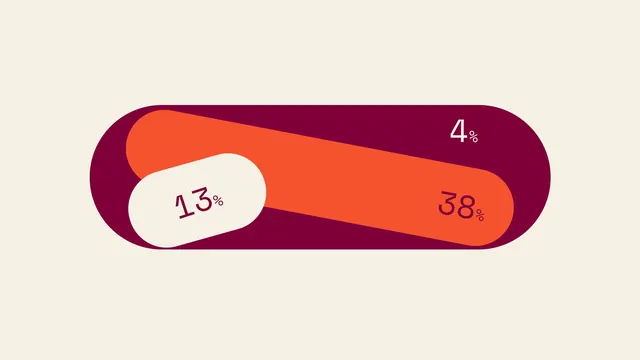
The design is clean, minimalist, and uses a simple bar chart visualization to present year-over-year growth data.
Summary
The design is clean, minimalist, and uses a simple bar chart visualization to present year-over-year growth data.
Visual description
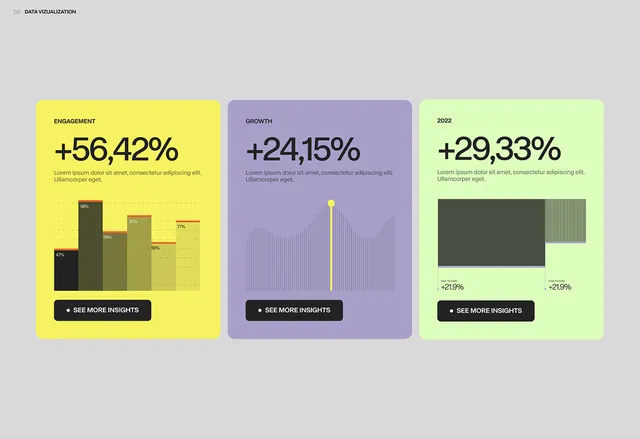
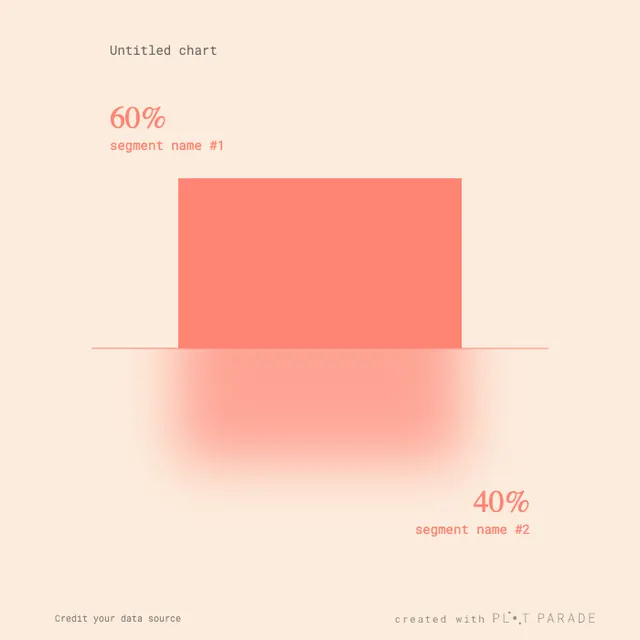
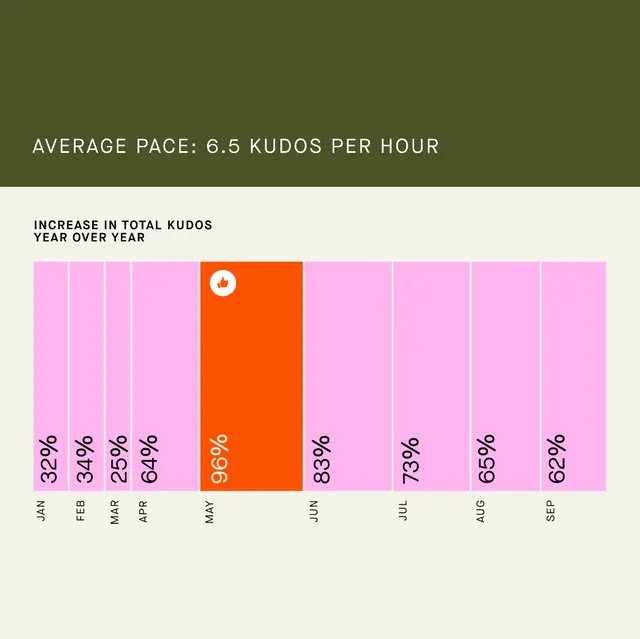
The design is clean, minimalist, and uses a simple bar chart visualization to present year-over-year growth data. The use of soft pinks and a strong orange accent against a muted olive green background creates a professional yet approachable feel. The layout is structured horizontally, using a clear title at the top followed by a series of vertical bars representing monthly percentage increases. Simple, sans-serif typeface is used for all text, prioritizing readability and a modern aesthetic.
Key takeaway
A data viz reference. Worth saving for its minimalist, data visualization, clean treatment.
Reuse notes
Fits analytics, fintech work.