Preview image. Unlock full-res
The image presents a conceptual diagram illustrating relationships between constituent parts using overlapping circles to denote connections.
Summary
The image presents a conceptual diagram illustrating relationships between constituent parts using overlapping circles to denote connections.
Visual description
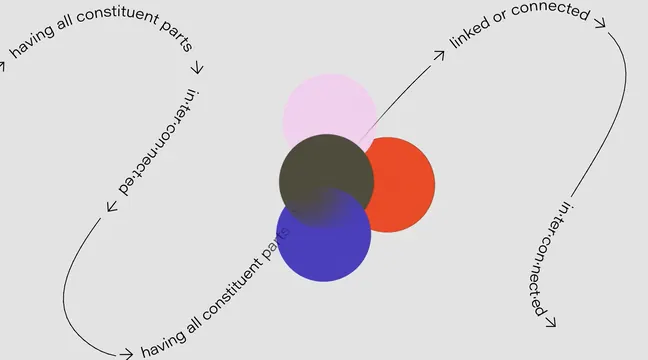
The image presents a conceptual diagram illustrating relationships between constituent parts using overlapping circles to denote connections. The design is clean and abstract, relying heavily on color and spatial overlap to convey complex relational data. The composition is centered around three overlapping circles, with directional arrows indicating relationships radiating outwards.
Key takeaway
A data viz reference. Worth saving for its diagrammatic, abstract, conceptual treatment.
Reuse notes
Fits analytics work.