Preview image. Unlock full-res
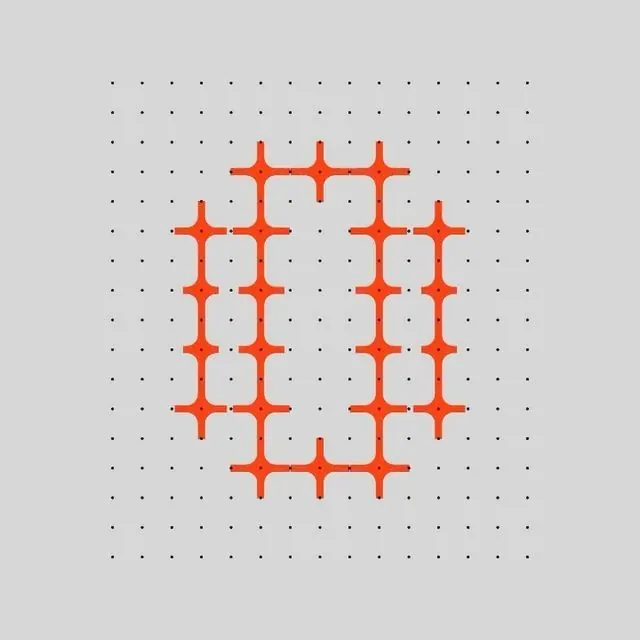
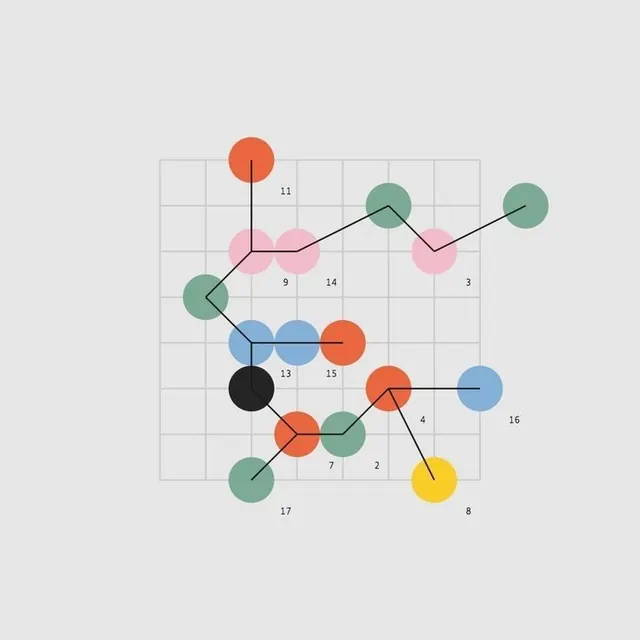
This is a scatter plot visualization using colored circles to represent data points, connected by lines to suggest relationships or sequences.
Summary
This is a scatter plot visualization using colored circles to represent data points, connected by lines to suggest relationships or sequences.
Visual description
This is a scatter plot visualization using colored circles to represent data points, connected by lines to suggest relationships or sequences. The design is clean and minimalist, relying primarily on color and position to convey information. The elements are distributed across a grid, with points connected by lines that create an irregular, flowing path across the visual field.
Key takeaway
A data viz reference. Worth saving for its data visualization, minimalist, scatter plot treatment.
Reuse notes
Fits analytics work.