Preview image. Unlock full-res
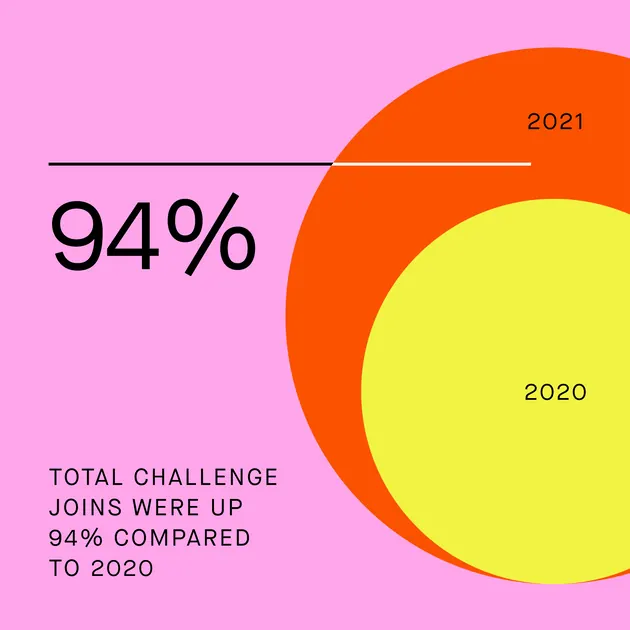
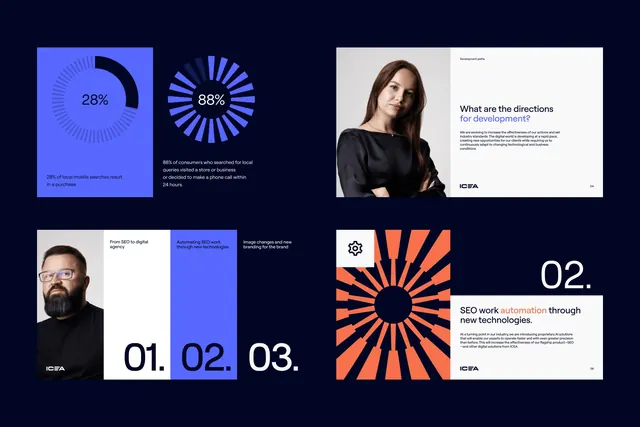
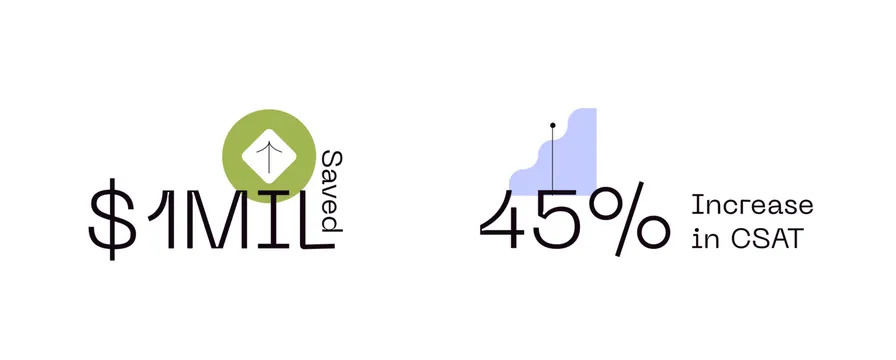
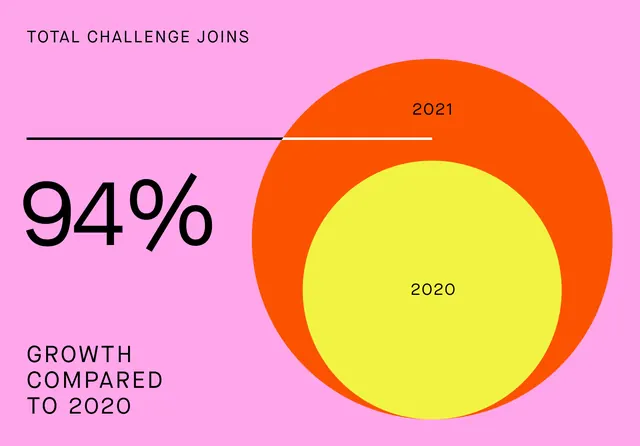
The image uses a bold, circular graphic to visually represent a high percentage growth, employing a clean, modern aesthetic with a limited, warm color palette.
Summary
The image uses a bold, circular graphic to visually represent a high percentage growth, employing a clean, modern aesthetic with a limited, warm color palette.
Visual description
The image uses a bold, circular graphic to visually represent a high percentage growth, employing a clean, modern aesthetic with a limited, warm color palette. The design is direct and focuses entirely on conveying a strong statistical achievement. The composition is dominated by overlapping circles, creating a clear visual hierarchy between the 2021 and 2020 data points. Clean, sans-serif typeface is used for the percentage and labels, emphasizing readability.
Key takeaway
A data viz reference. Worth saving for its minimalist, data visualization, geometric treatment.
Reuse notes
Fits analytics, b2b work.