Preview image. Unlock full-res
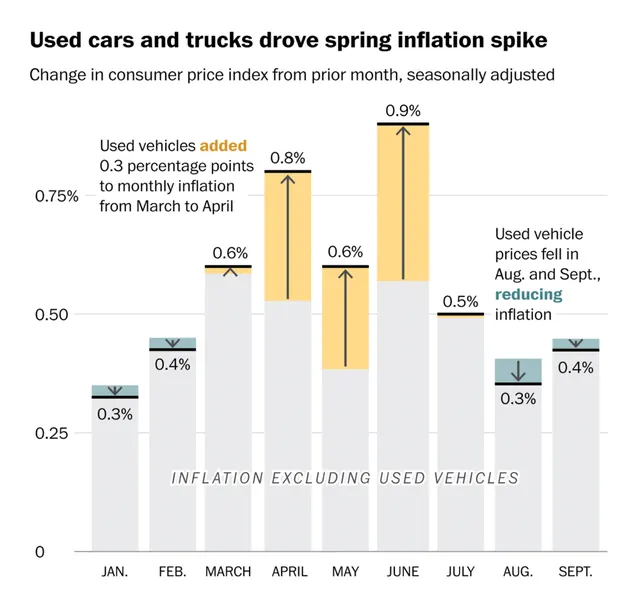
This is a data visualization presenting monthly inflation rates for used cars and trucks, adjusted for the prior month, spanning from January to September.
Summary
This is a data visualization presenting monthly inflation rates for used cars and trucks, adjusted for the prior month, spanning from January to September.
Visual description
This is a data visualization presenting monthly inflation rates for used cars and trucks, adjusted for the prior month, spanning from January to September. The design uses a simple bar chart format with distinct color coding for different data series. The data is presented in a clear, horizontal bar chart format with monthly labels along the x-axis. sans-serif, clean and legible for data presentation
Key takeaway
A data viz reference. Worth saving for its data visualization, bar chart, statistical treatment.
Reuse notes
Fits fintech work.