Preview image. Unlock full-res
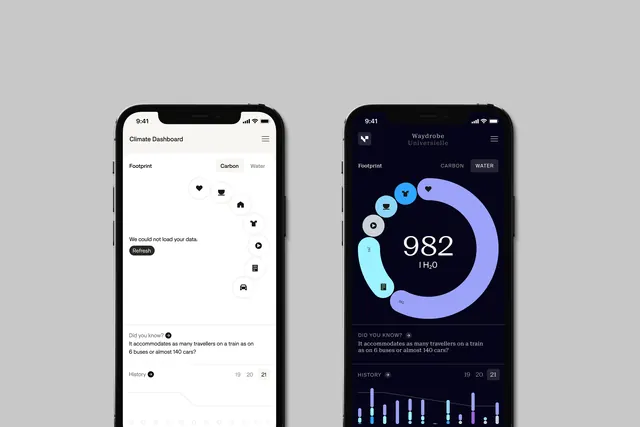
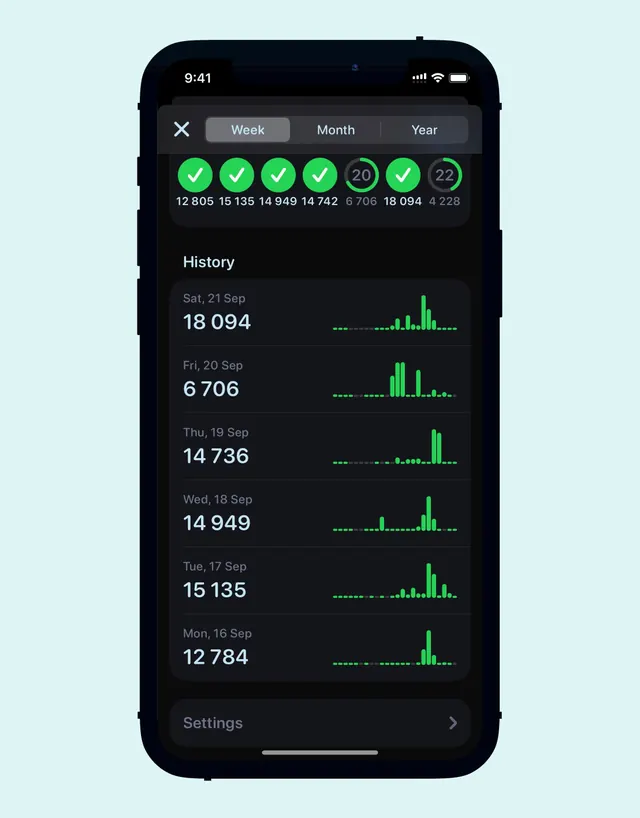
This dashboard features a clean, dark-mode interface optimized for displaying complex geospatial and environmental metrics.
Summary
This dashboard features a clean, dark-mode interface optimized for displaying complex geospatial and environmental metrics.
Visual description
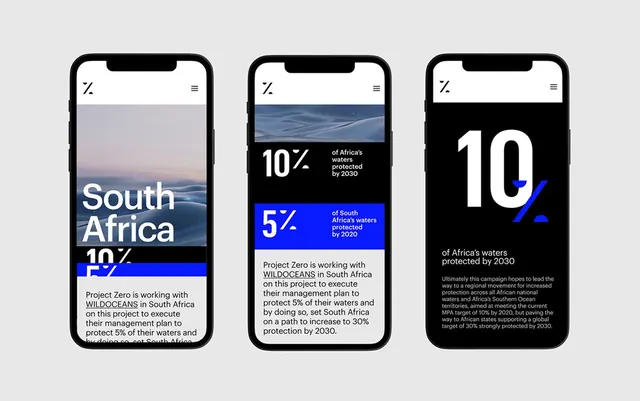
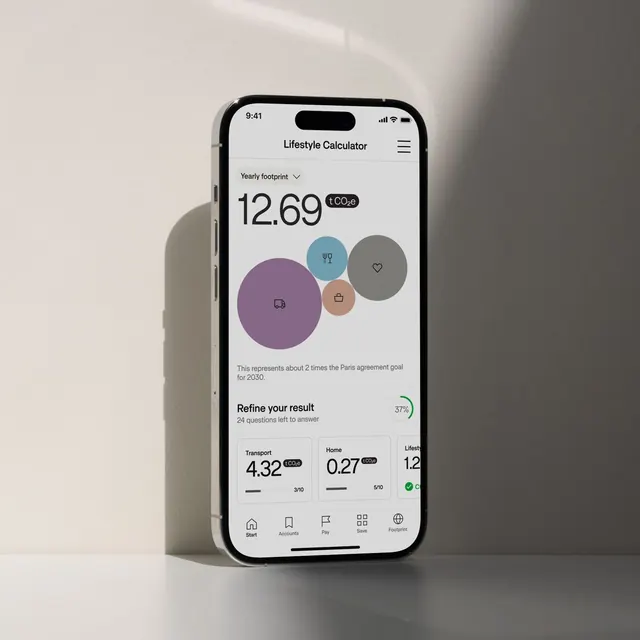
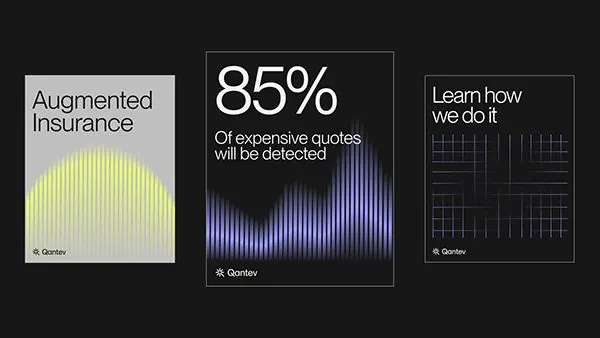
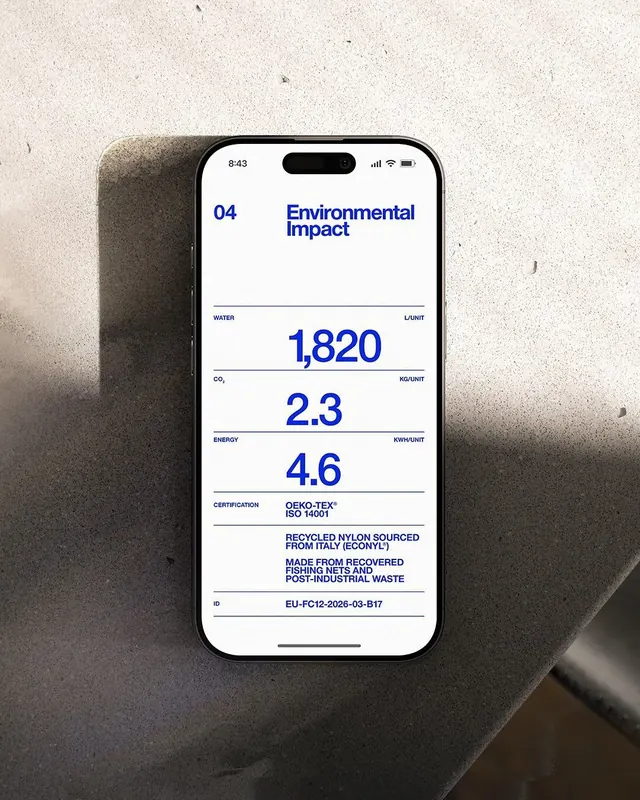
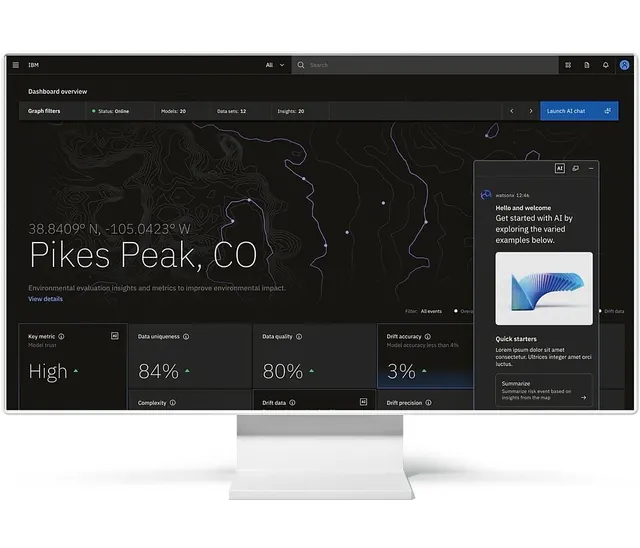
This dashboard features a clean, dark-mode interface optimized for displaying complex geospatial and environmental metrics. The design utilizes clear hierarchy, combining a topographical map with distinct metric cards to provide immediate analytical insights into the selected location. The visual language is professional, sparse, and highly focused on data readability. The composition is a balanced grid structure, using negative space effectively to segment navigation, mapping, and statistical results into easily digestible sections. A modern, legible sans-serif typeface is used throughout for high readability of technical data and labels.
Key takeaway
A data viz reference. Worth saving for its dark mode, data visualization, dashboard ui treatment.
Reuse notes
Fits general design work.