Preview image. Unlock full-res
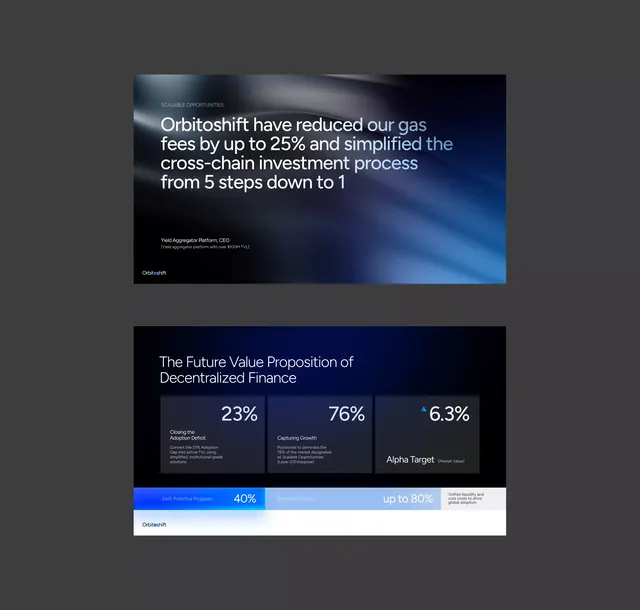
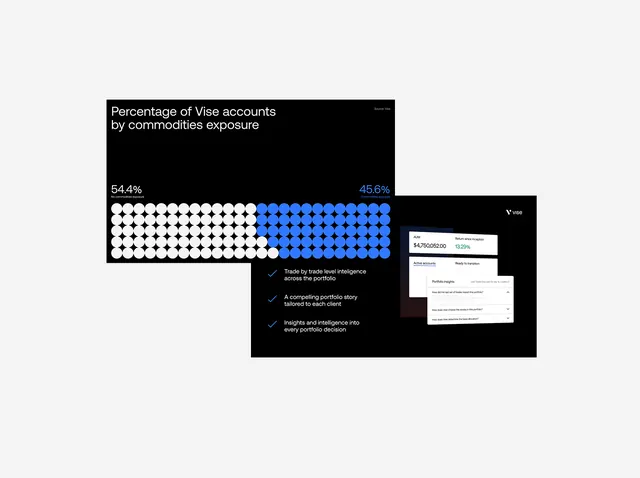
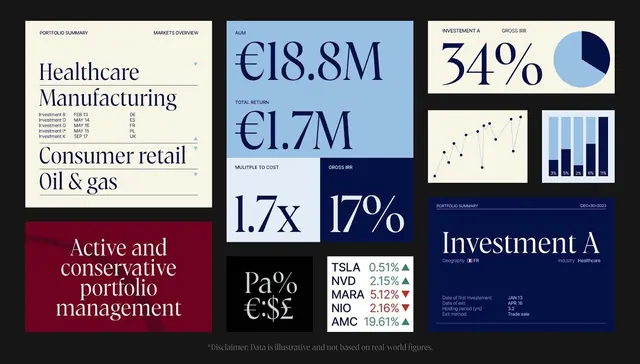
This dashboard utilizes a sophisticated dark mode theme to present complex financial data in a highly structured and analytical manner.
Summary
This dashboard utilizes a sophisticated dark mode theme to present complex financial data in a highly structured and analytical manner.
Visual description
This dashboard utilizes a sophisticated dark mode theme to present complex financial data in a highly structured and analytical manner. The visual language relies on clear typography, contrasting accents, and organized charts to ensure data readability and professional presentation. The composition uses a clear modular grid structure, dividing the screen into distinct cards for different investment metrics and summaries. Clear sans-serif fonts are used, often bolded for key metrics and numbers.
Key takeaway
A data viz reference. Worth saving for its dark mode, corporate, data visualization treatment.
Reuse notes
Fits fintech work.