Preview image. Unlock full-res
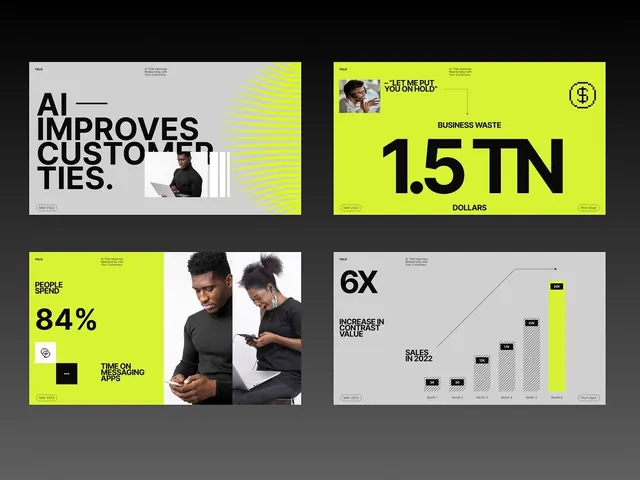
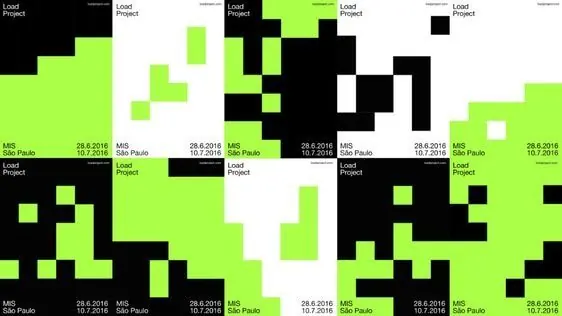
The image presents a grid-like visualization, likely representing data or project status across different categories.
Styledata-dense, abstract, minimal
Colordark, light, high-contrast, neon, vibrant
Tagsbinary, grid, high contrast, modular, analytical, structured, clinical, sharp, dichotomous, data analysis, software interface, reporting, dashboard, black, lime green, white, grey, monochromatic, mixed, lime, neutral
Palette
#FFFFFF
#ABFF47
#030303
#A2E64D
#5B7045
Summary
The image presents a grid-like visualization, likely representing data or project status across different categories.
Visual description
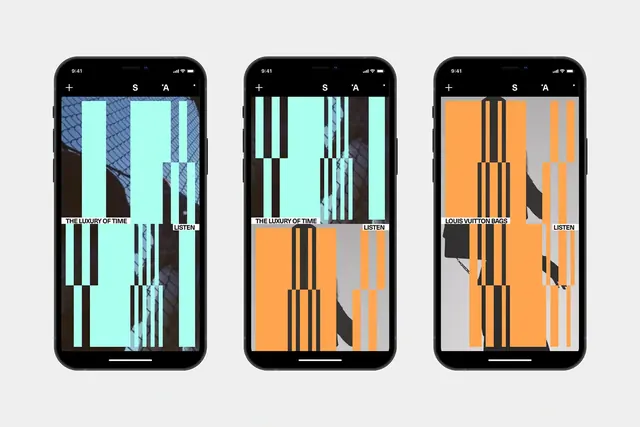
The image presents a grid-like visualization, likely representing data or project status across different categories. It uses a stark binary contrast between black and bright lime green to delineate areas, creating a high-contrast, analytical feel. The composition is a matrix of rectangular cells, organized into rows and columns to display segmented information.
Key takeaway
A data viz reference. Worth saving for its binary, grid, data visualization treatment.
Reuse notes
Fits general design work.