Preview image. Unlock full-res
This design employs a clean, minimalist aesthetic to present statistical data through contrasting visual elements.
Summary
This design employs a clean, minimalist aesthetic to present statistical data through contrasting visual elements.
Visual description
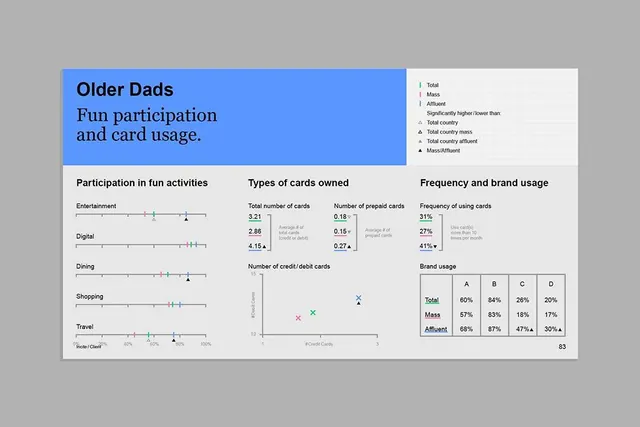
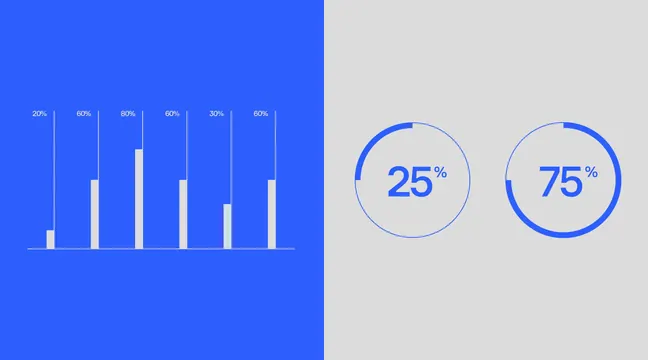
This design employs a clean, minimalist aesthetic to present statistical data through contrasting visual elements. It effectively uses bar charts and circular graphs in a divided layout to facilitate quick comparison and understanding of quantitative information. The image uses a split composition, contrasting a vibrant blue background for one visualization and a neutral gray for the other, creating clear visual separation. sans-serif display font used for labels and percentages, highly legible.
Key takeaway
A data viz reference. Worth saving for its data visualization, minimalist, clean lines treatment.
Reuse notes
Fits analytics, fintech work.