Preview image. Unlock full-res
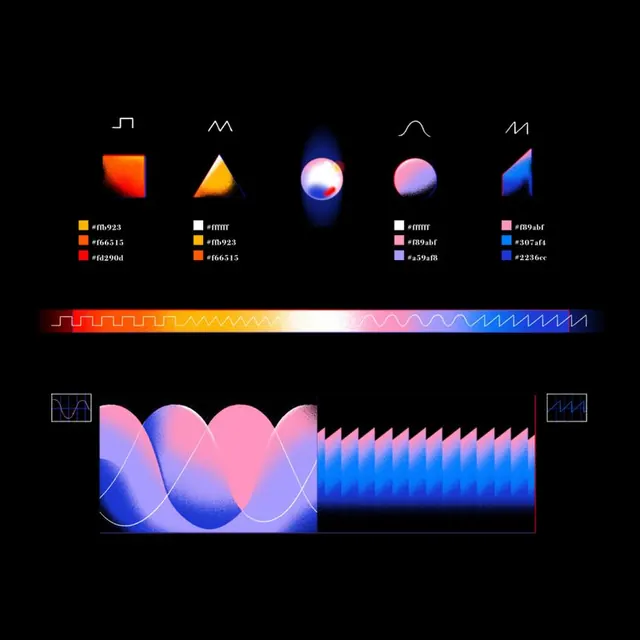
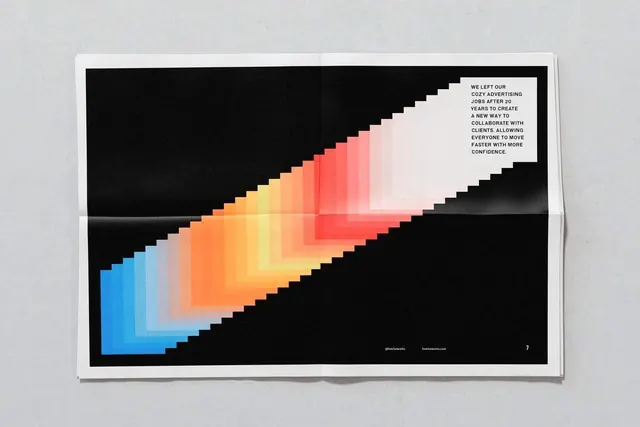
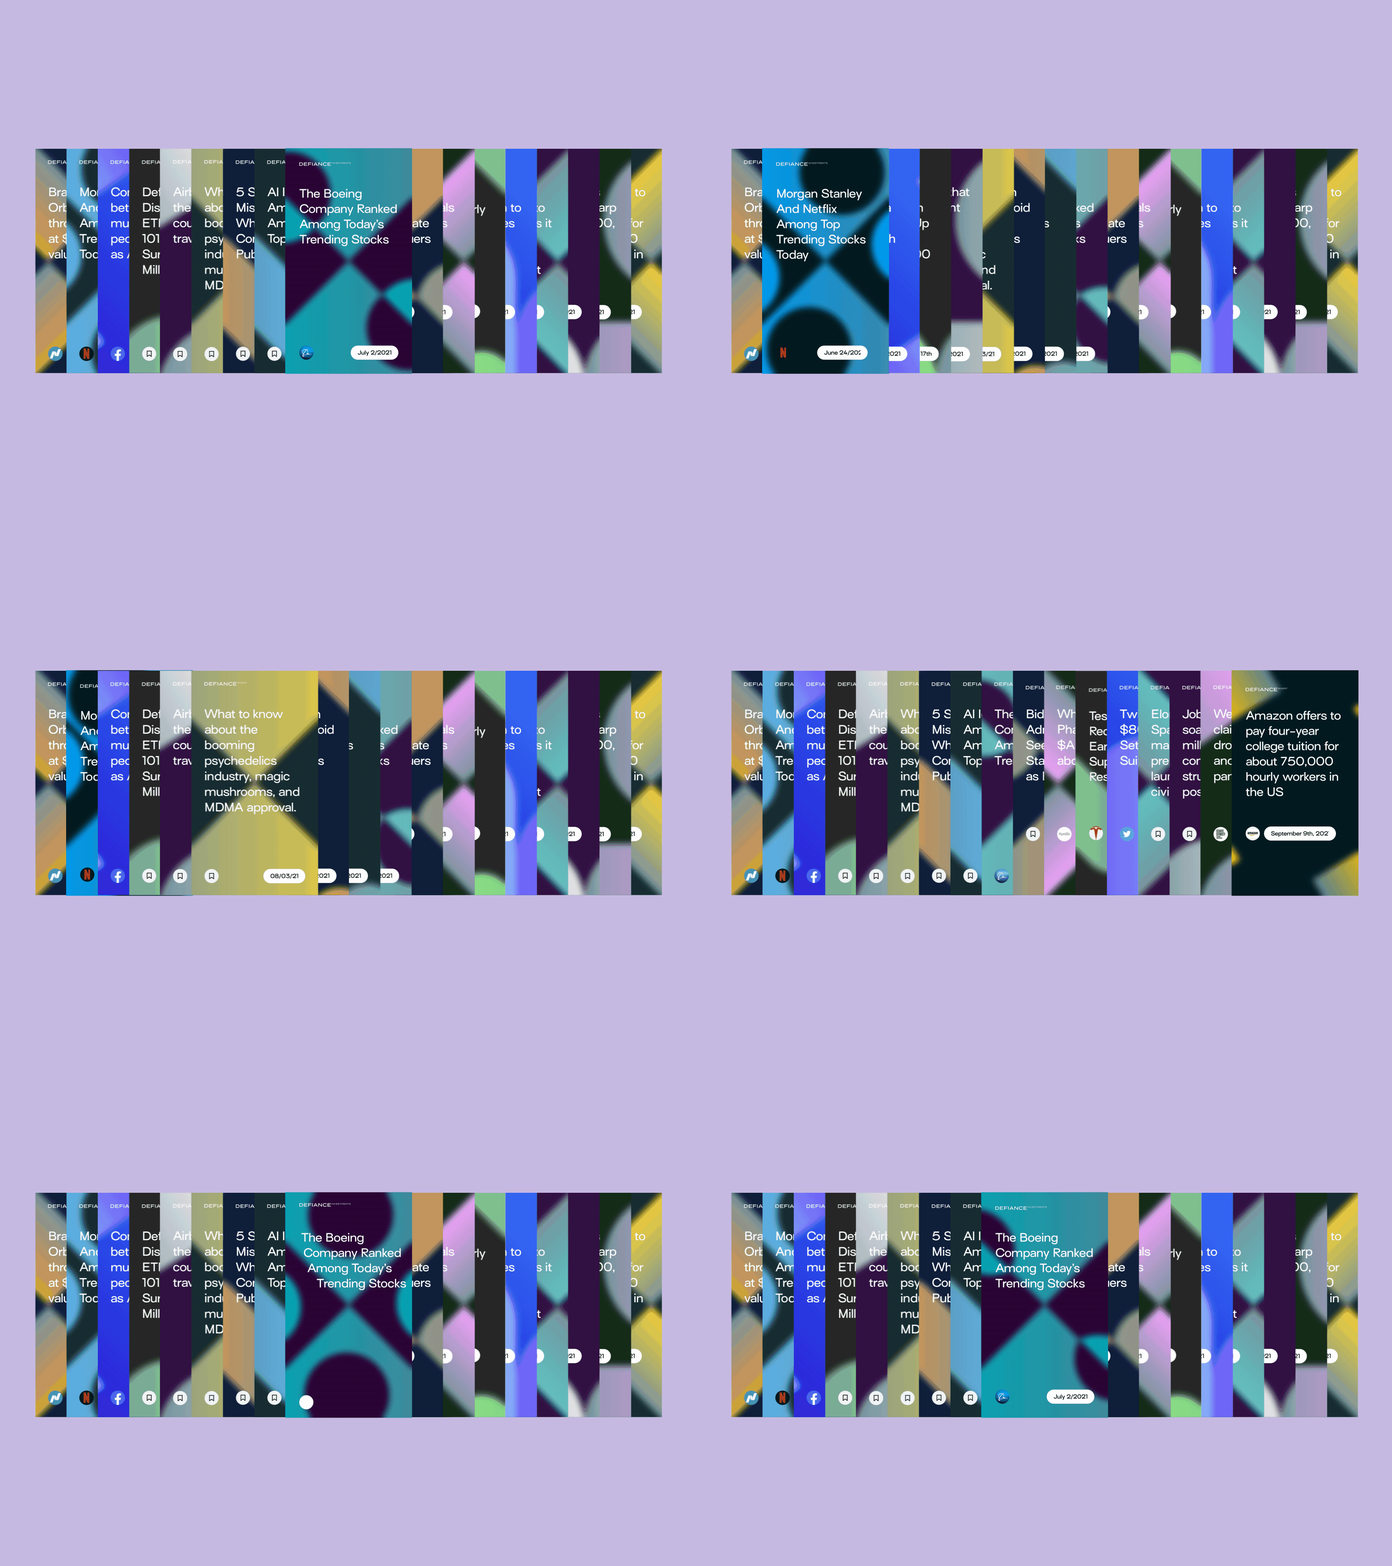
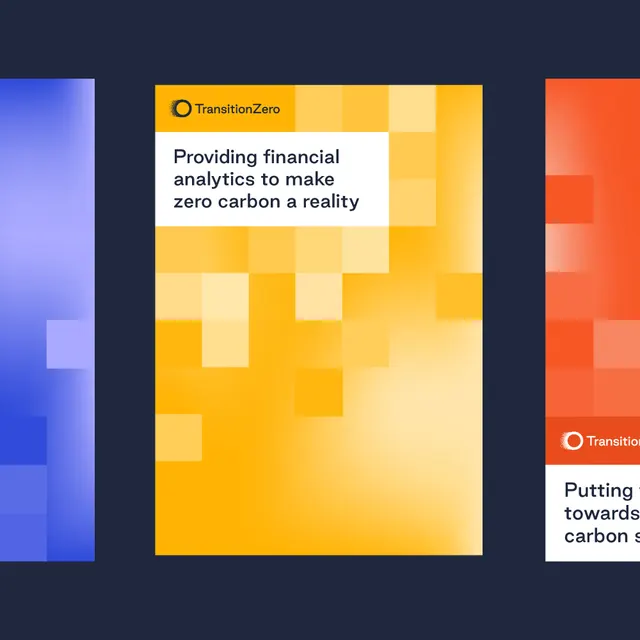
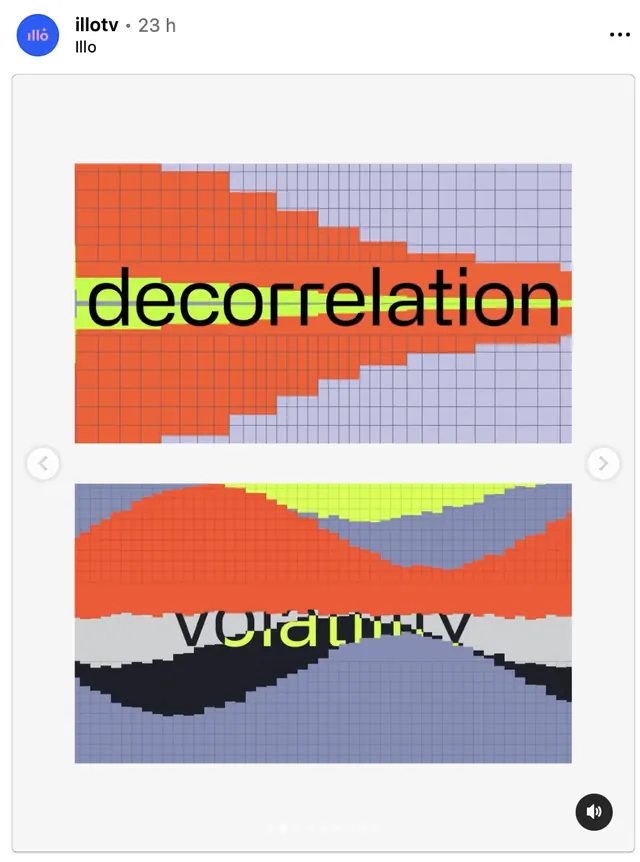
This image features two stacked data visualizations using grid structures and color gradients to represent abstract concepts like decorrelation and volatility.
Summary
This image features two stacked data visualizations using grid structures and color gradients to represent abstract concepts like decorrelation and volatility.
Visual description
This image features two stacked data visualizations using grid structures and color gradients to represent abstract concepts like decorrelation and volatility. The design utilizes a clean, modern aesthetic focused on conveying complex data relationships through visual metaphors. The composition is structured vertically, presenting two distinct graph-like panels side-by-side on a uniform grid. A clean, modern sans-serif typeface is used for the labels and titles.
Key takeaway
A data viz reference. Worth saving for its data visualization, minimalist, heatmap treatment.
Reuse notes
Fits fintech work.