Preview image. Unlock full-res
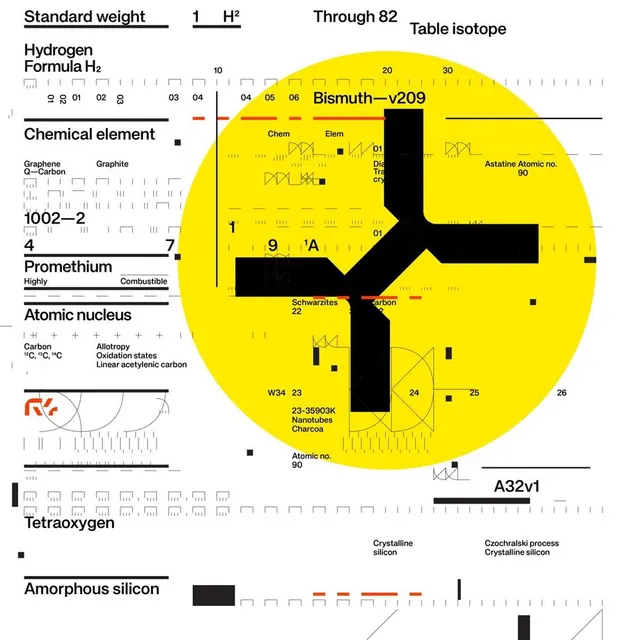
A complex scientific diagram integrating periodic table elements, chemical structures, and detailed annotations in black, white, and bright yellow.
Summary
A densely detailed scientific information graphic showing periodic table elements, chemical structures, and isotope data organized with a prominent bright yellow circular form overlaid with black geometric shapes.
Visual description
Left side displays tabular data and chemical notations in black text on white. The right side features a large yellow circle containing black angular geometric shapes resembling a cross or molecular structure, with scattered labels and atomic numbers. Small diagrams and technical annotations fill the composition, demonstrating data-heavy scientific visualization with high contrast color blocking.
Key takeaway
The bold yellow circle creates visual hierarchy and breaks up dense technical information. High-contrast black, white, and neon yellow color scheme makes complex data scannable and engaging.
Reuse notes
Excellent model for scientific and technical documentation needing to combine tabular data with visual diagrams. The color blocking strategy works well to separate different information types and draw focus.
More like this




Keep what you find
A free account saves references to boards and can send you a weekly email of picks based on what you save.
To see every result, go Pro.