Preview image. Unlock full-res
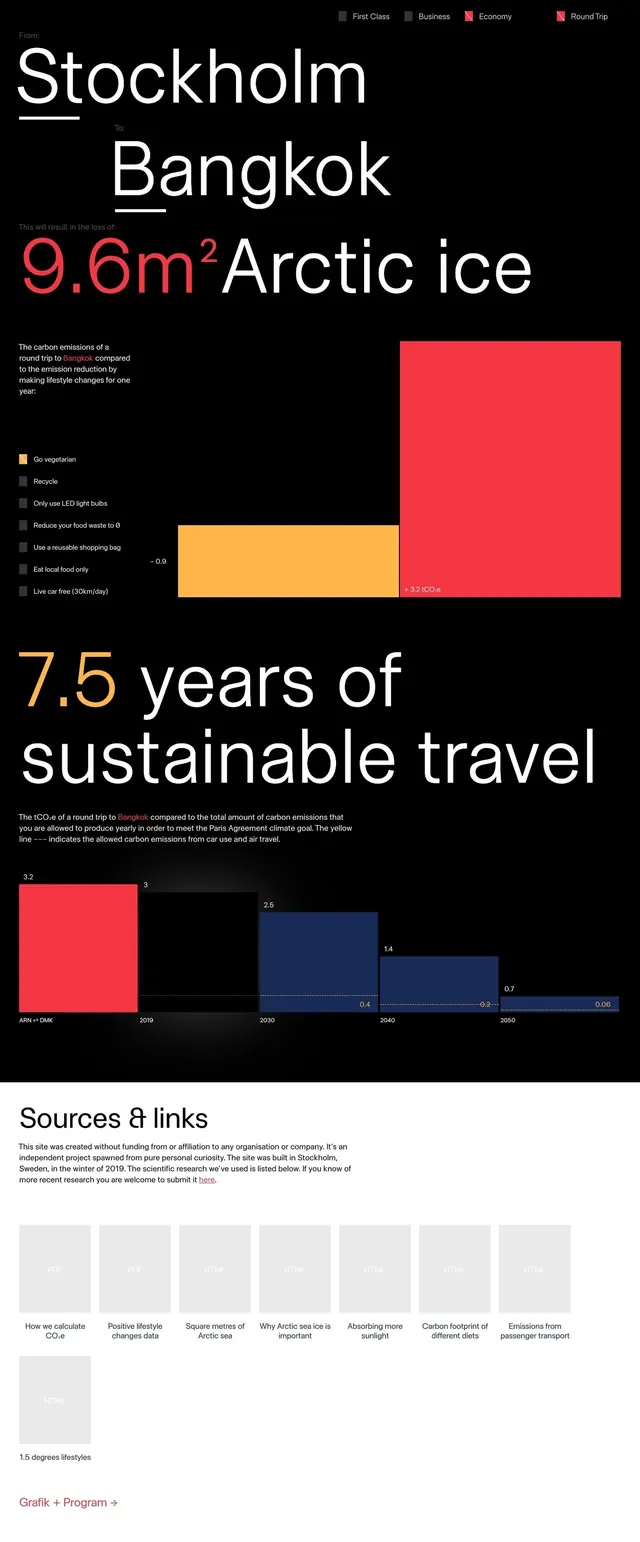
A data-dense editorial layout showcasing travel statistics and sustainability metrics using bold blocks and typography.
Summary
A data-dense editorial layout showcasing travel statistics and sustainability metrics using bold blocks and typography.
Visual description
The design features large, bold white typography against a black background, complemented by vibrant red, orange, and blue rectangular blocks. It includes a bar chart and a grid of gray boxes at the bottom.
Key takeaway
Use high-contrast colors and oversized typography to make complex data points immediately legible and impactful.
Reuse notes
Apply this layout for corporate social responsibility reports or data-heavy marketing presentations.
More like this

Keep what you find
A free account saves references to boards and can send you a weekly email of picks based on what you save.
To see every result, go Pro.