Preview image. Unlock full-res
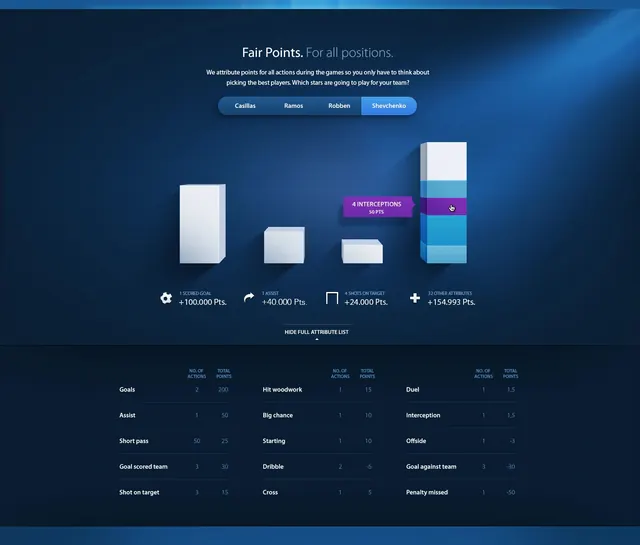
A dark-mode data visualization dashboard displaying player performance metrics through 3D bar charts and a detailed statistical table.
Summary
A dark-mode data visualization dashboard displaying player performance metrics through 3D bar charts and a detailed statistical table.
Visual description
The layout features a dark blue gradient background with white and light blue 3D rectangular bars of varying heights. Key metrics are highlighted with icons and large point values, while a detailed data table at the bottom organizes statistics into columns. The typography is clean and sans-serif, using white text for high contrast against the dark background.
Key takeaway
Use 3D volumetric bars to provide a sense of depth and hierarchy to comparative data points.
Reuse notes
Ideal for sports analytics apps or gaming leaderboards where visual impact of performance metrics is essential.
More like this




Keep what you find
A free account saves references to boards and can send you a weekly email of picks based on what you save.
To see every result, go Pro.