Preview image. Unlock full-res
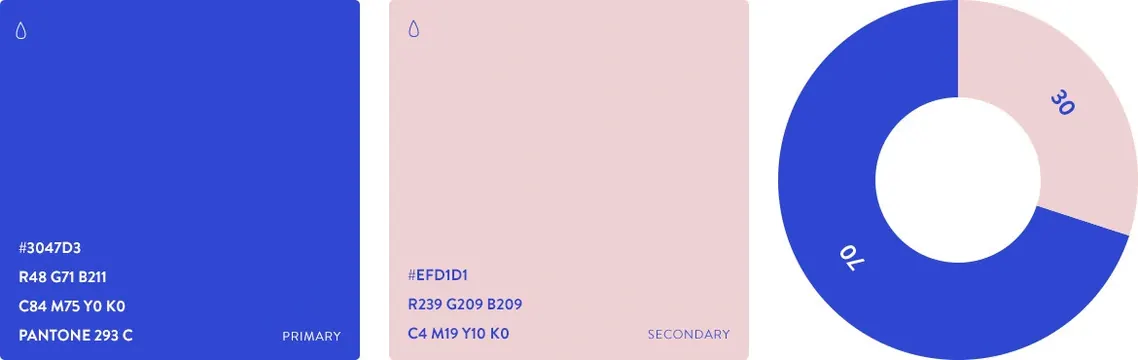
A three-panel design layout featuring a blue block with text, a pink block with text, and a donut chart showing data distribution.
Summary
A three-panel design layout featuring a blue block with text, a pink block with text, and a donut chart showing data distribution.
Visual description
The image is divided into three vertical sections. The left section is solid blue with white text, the middle is light pink with dark text, and the right features a donut chart with blue and pink segments.
Key takeaway
The design uses a clean, high-contrast color palette and geometric shapes to present data and information clearly.
Reuse notes
This layout can be used as a template for presenting statistics or key performance indicators in a presentation.
More like this



Keep what you find
A free account saves references to boards and can send you a weekly email of picks based on what you save.
To see every result, go Pro.