Preview image. Unlock full-res
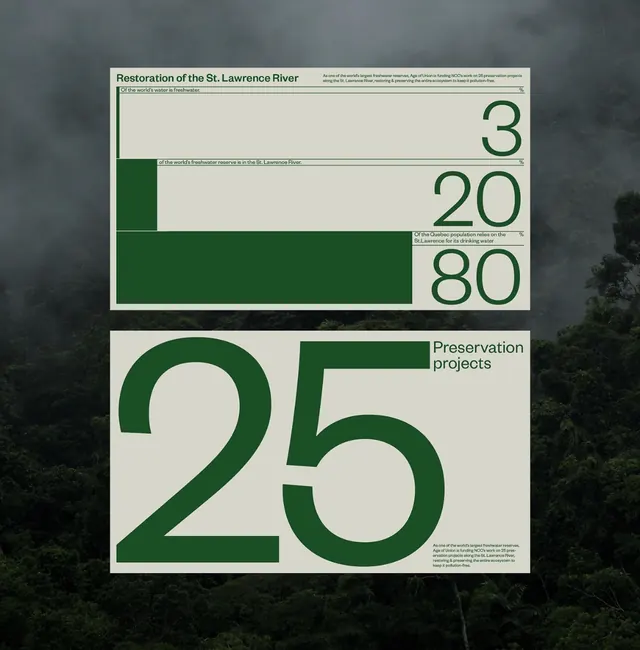
A data-driven graphic featuring a large numerical breakdown of the 'Restoration of the Lawrence River' project, set against a dark, atmospheric forest background.
Summary
A data-driven graphic featuring a large numerical breakdown of the 'Restoration of the Lawrence River' project, set against a dark, atmospheric forest background.
Visual description
The design features a large white box containing a green bar chart and oversized numbers (3, 20, 80) representing project data. The background is a moody, dark photograph of a dense forest.
Key takeaway
The design effectively uses high-contrast typography and a structured grid to make complex environmental data easily digestible.
Reuse notes
This layout can be adapted for any project requiring a clear, impactful breakdown of statistics or milestones.
More like this


Keep what you find
A free account saves references to boards and can send you a weekly email of picks based on what you save.
To see every result, go Pro.