Preview image. Unlock full-res
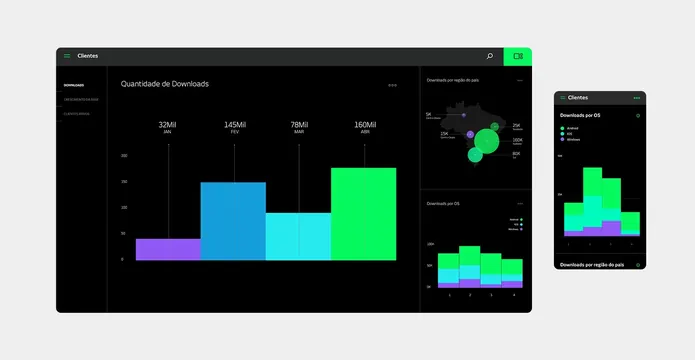
A dark-mode analytics dashboard featuring a large bar chart and a smaller secondary chart with vibrant neon accents.
Summary
A dark-mode analytics dashboard featuring a large bar chart and a smaller secondary chart with vibrant neon accents.
Visual description
The design features a dark background with high-contrast neon green, blue, and purple bars. It includes a large primary bar chart and a smaller secondary chart with a circular data point.
Key takeaway
The use of vibrant neon colors against a dark background creates a high-impact, modern aesthetic for data readability.
Reuse notes
This layout can be adapted for any SaaS analytics platform or financial reporting tool.
More like this



Keep what you find
A free account saves references to boards and can send you a weekly email of picks based on what you save.
To see every result, go Pro.