Preview image. Unlock full-res
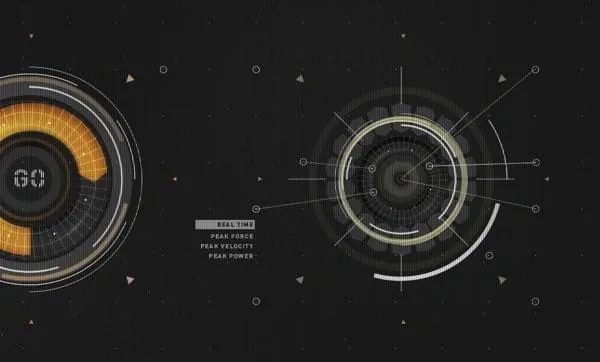
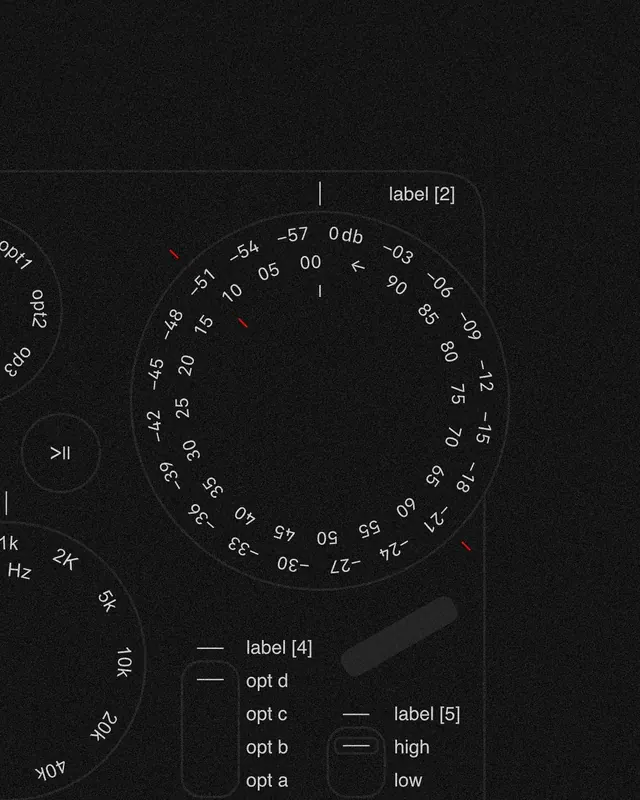
A dark-mode UI dashboard featuring circular progress indicators, data points, and technical line-art elements.
Summary
A dark-mode UI dashboard featuring circular progress indicators, data points, and technical line-art elements.
Visual description
The design features a dark background with two primary circular graphics: one with a thick orange progress ring and a central '60' value, and another complex concentric ring with radiating data lines. Small text labels and dots are distributed across the layout to represent data points.
Key takeaway
The design effectively uses high-contrast line-art and geometric shapes to convey complex data in a clean, technical aesthetic.
Reuse notes
This layout can be adapted for financial tracking apps, crypto dashboards, or high-tech analytics interfaces.
More like this
Keep what you find
A free account saves references to boards and can send you a weekly email of picks based on what you save.
To see every result, go Pro.