Preview image. Unlock full-res
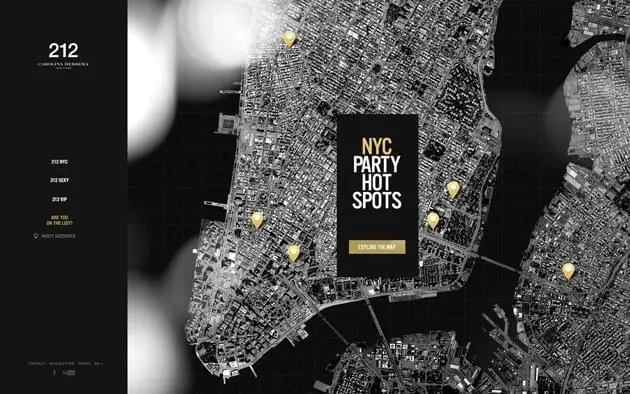
Promotional website for Carolina Herrera's 212 fragrance featuring a grayscale satellite map of Manhattan with golden location pins and a nightlife discovery call-to-action card.
Summary
A promotional website for Carolina Herrera's 212 fragrance that overlays golden location pins on a grayscale satellite map of Manhattan, inviting users to explore the city's nightlife hotspots.
Visual description
The page displays a grayscale satellite map of Manhattan with several golden circular pins marking nightlife venues. A black call-out card in the center features "NYC PARTY HOT SPOTS" in white and golden text, with an "EXPLORE THE MAP" button below. The left sidebar shows the 212 fragrance branding with product variants (212 NYC, 212 SEXY, 212 VIP) and navigation menu items. A soft glow effect behind the main content area adds atmospheric depth.
Key takeaway
Uses an interactive map interface to connect a luxury fragrance brand with aspirational nightlife culture, turning product promotion into an experiential discovery tool.
Reuse notes
Effective for luxury or lifestyle brands seeking to anchor their product positioning around specific locations or experiences. The contrast between grayscale map and golden accents creates visual hierarchy that guides attention to the call-to-action.
More like this




Keep what you find
A free account saves references to boards and can send you a weekly email of picks based on what you save.
To see every result, go Pro.