Preview image. Unlock full-res
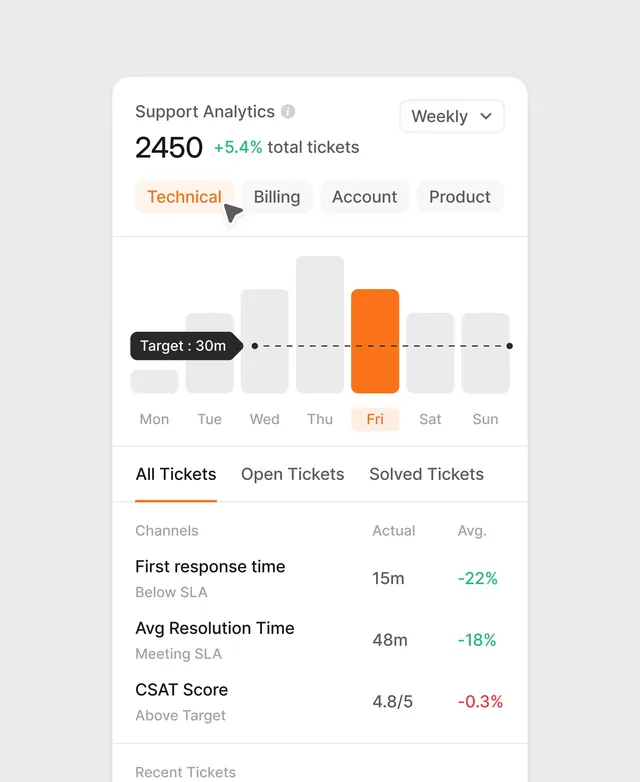
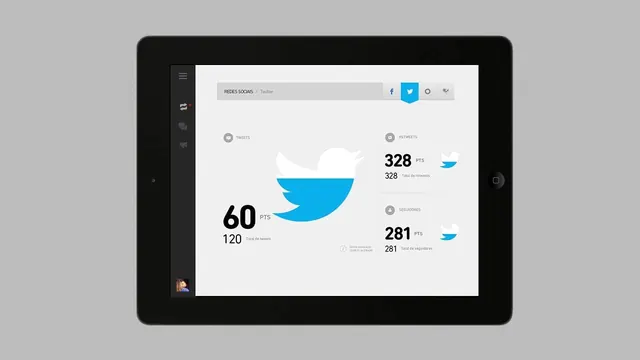
A data-dense dashboard interface displaying support ticket metrics, including total counts, trends, and resolution times.
Summary
A data-dense dashboard interface displaying support ticket metrics, including total counts, trends, and resolution times.
Visual description
A clean white dashboard featuring a large numerical metric with a percentage change, a bar chart with a target line, and a detailed data table. The layout uses a grid system with distinct sections for navigation and performance indicators.
Key takeaway
The design prioritizes clarity and information hierarchy to make complex data easily digestible at a glance.
Reuse notes
Use this layout for internal reporting tools or customer-facing analytics panels.
More like this

Keep what you find
A free account saves references to boards and can send you a weekly email of picks based on what you save.
To see every result, go Pro.