Preview image. Unlock full-res
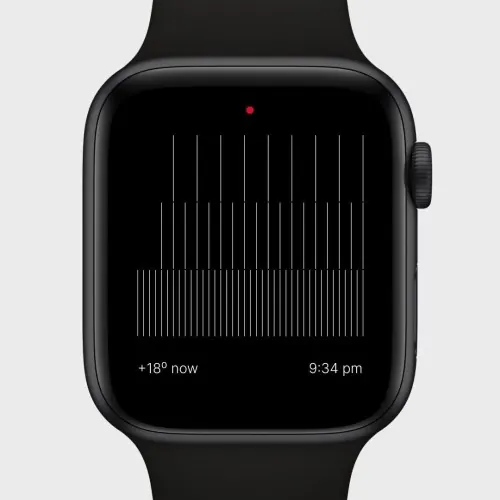
A dark-mode smartwatch display showing a vertical bar graph representing temperature or weather data.
Summary
A dark-mode smartwatch display showing a vertical bar graph representing temperature or weather data.
Visual description
A black smartwatch face featuring a white vertical bar chart with varying heights. The bottom displays '+18° now' on the left and '9:34 pm' on the right, with a single red dot at the top.
Key takeaway
Uses high-contrast minimalist elements to convey complex data clearly on a small screen.
Reuse notes
Apply the vertical bar chart style and high-contrast layout for other data-driven wearable interfaces.
More like this
Keep what you find
A free account saves references to boards and can send you a weekly email of picks based on what you save.
To see every result, go Pro.