Preview image. Unlock full-res
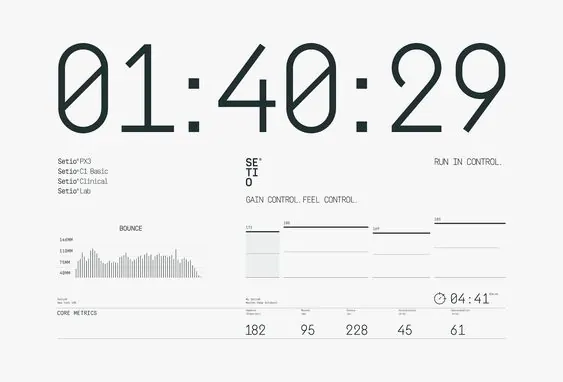
A high-density data visualization layout featuring a large digital clock, performance charts, and numerical metrics.
Summary
A high-density data visualization layout featuring a large digital clock, performance charts, and numerical metrics.
Visual description
The design features a large white monospace timer at the top. Below, it displays line graphs, percentage indicators, and a grid of numerical values against a dark background.
Key takeaway
The layout prioritizes information density and readability through a strict grid and monospace typography.
Reuse notes
Use this layout for real-time monitoring systems or technical performance dashboards.
More like this

Keep what you find
A free account saves references to boards and can send you a weekly email of picks based on what you save.
To see every result, go Pro.