Preview image. Unlock full-res
A clean animated data dashboard showcasing key financial metrics with purple gradient charts that build into view, presenting stats like $1B interest paid and $3.23T in cumulative deposits.
Summary
A clean animated data dashboard showcasing key financial metrics with purple gradient charts that build into view, presenting stats like $1B interest paid and $3.23T in cumulative deposits.
Visual description
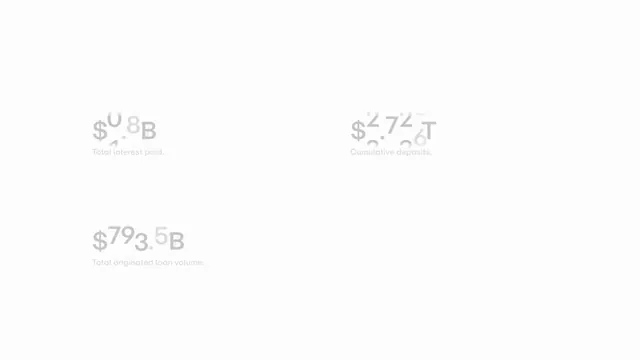
Three oversized financial figures appear on a pale background in light gray: $1.8B (Total interest paid), $2.72T (Cumulative deposits), and $793.5B (Total originated loan volume). The digits show partial opacity and staggered visibility, suggesting an in-flight animation where numbers are counting or building into view, one fragment at a time.
Key takeaway
Animate large metric values by staggering the opacity or appearance of individual digits to create motion and interest without complex keyframe choreography, keeping data hierarchy clear.
Reuse notes
Reach for this as a motion still reference. Pairs with minimal, clean directions. Original by ana howard.