Preview image. Unlock full-res
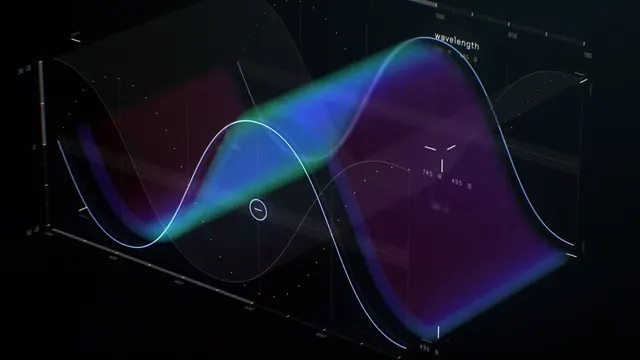
A high-contrast digital layout featuring abstract blue and purple data streams with a prominent headline about forecasting speed.
Summary
A high-contrast digital layout featuring abstract blue and purple data streams with a prominent headline about forecasting speed.
Visual description
The design features a dark background with horizontal, glowing blue and purple bars of varying lengths and opacities. A large white headline is positioned on the right side over a vibrant blue gradient block.
Key takeaway
Uses dynamic, glowing gradients to represent high-speed data processing and real-time analytics.
Reuse notes
Apply the glowing horizontal bar motif to represent progress, data streams, or timeline visualizations.
More like this
Keep what you find
A free account saves references to boards and can send you a weekly email of picks based on what you save.
To see every result, go Pro.