Preview image. Unlock full-res
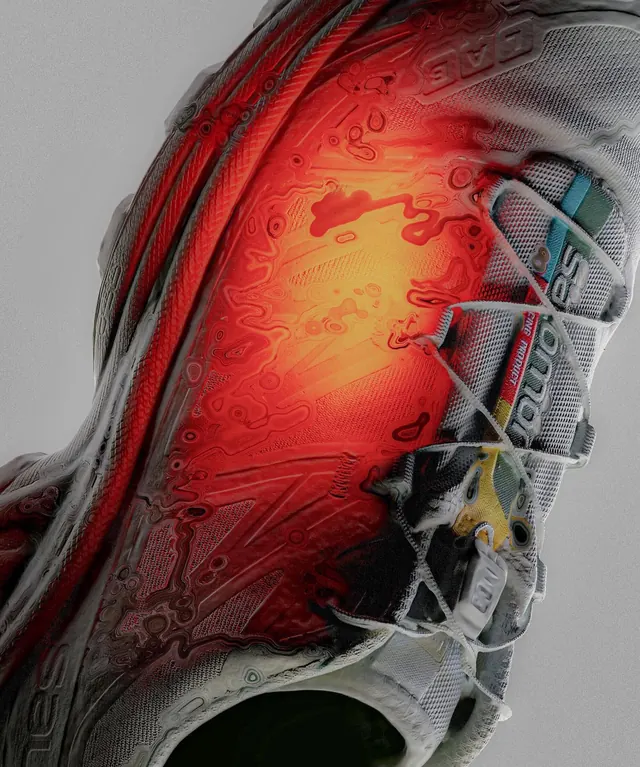
Close-up product photograph of a shoe sole with a bold thermal heat-map graphic overlay in red and orange against a neutral background.

Summary
A product photograph of a sneaker sole overlaid with a vibrant thermal heat-map visualization in reds and oranges, showing pressure or impact distribution patterns.
Visual description
The shoe sole is photographed from an angle showing its underside detail. A red-to-orange heat-map graphic covers much of the surface, displaying gradient intensity patterns typical of pressure or thermal analysis. A fabric strap with branding runs across the side. The background is a neutral gray, isolating the product and making the heat-map stand out.
Key takeaway
Combining technical data visualization (heat mapping) with product photography to communicate performance or material properties in an visually compelling way.
Reuse notes
Useful for athletic or technical footwear branding that wants to emphasize engineering or performance benefits. The heat-map overlay style works well for communicating invisible properties (pressure, temperature, impact).
More like this









Keep what you find
A free account saves references to boards and can send you a weekly email of picks based on what you save.
To see every result, go Pro.