Preview image. Unlock full-res
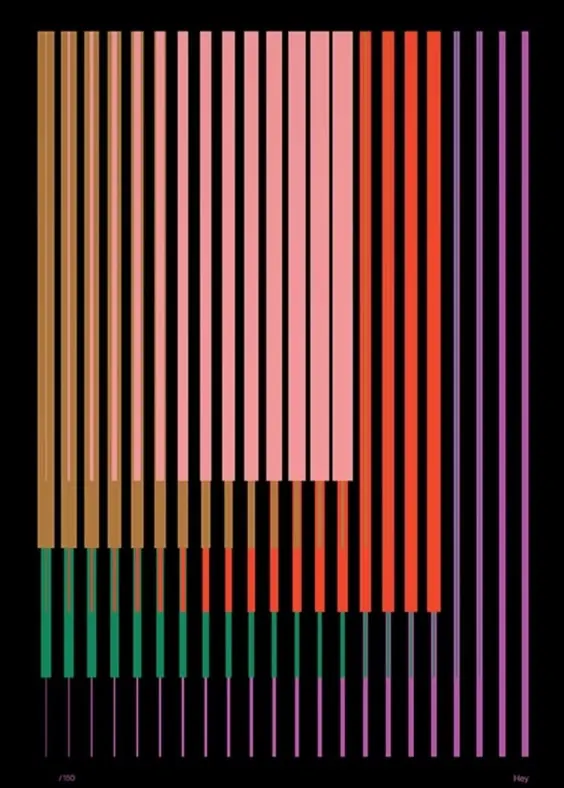
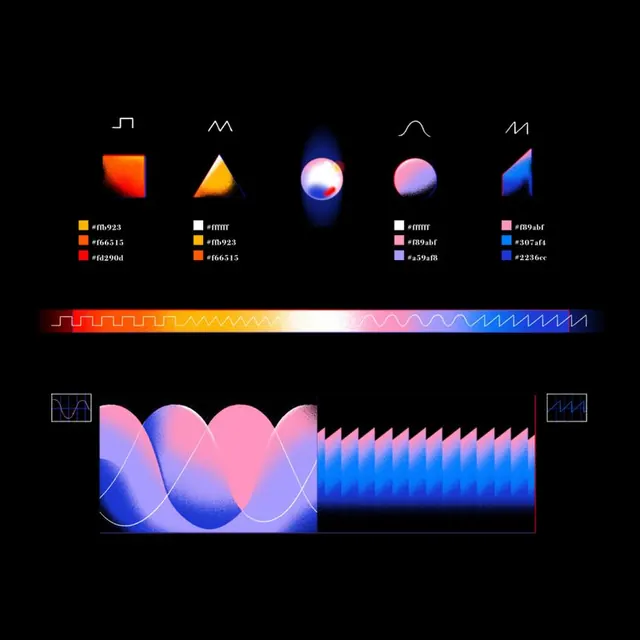
Vertical color spectrum visualization with parallel lines transitioning across warm oranges, reds, purples, and cool greens.
Summary
A color spectrum visualization displayed as parallel vertical lines transitioning through warm peachy tones, coral reds, purples, and cool greens against pure black.
Visual description
Tightly spaced parallel vertical lines fill most of the frame, each line representing a specific hue. The spectrum progresses from warm golden-orange at left through pink, coral, and red in the center, then through purple to cool green at lower left, all against deep black background. The lines maintain consistent width but shift in color sequentially, creating a smooth gradient effect. Small axis labels appear at bottom corners suggesting this is a data visualization or color model reference.
Key takeaway
Representing color data through parallel lines creates both visual harmony and technical clarity. The sequential progression across the color spectrum is intuitive while the geometric format feels contemporary and graphic.
Reuse notes
Strong reference for data visualization, color theory materials, or contemporary design systems. Works well for scientific or educational contexts requiring color taxonomy. The line-based approach is scalable and reproducible. Can be adapted for different color models or palettes.
More like this

Keep what you find
A free account saves references to boards and can send you a weekly email of picks based on what you save.
To see every result, go Pro.