Preview image. Unlock full-res
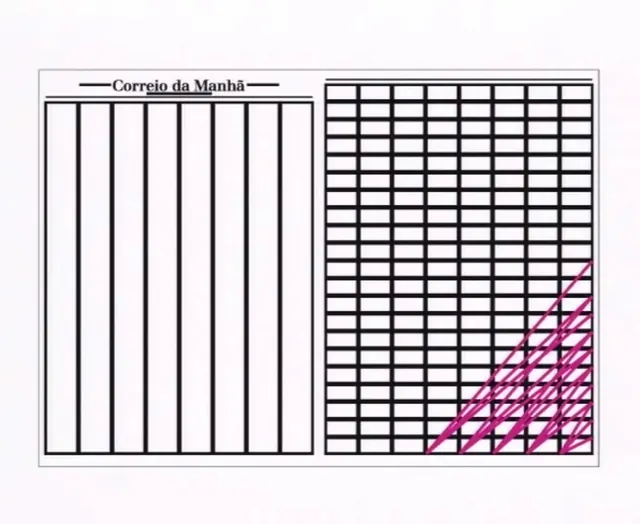
A documentary-style newspaper chart showing two side-by-side grid visualizations, one with vertical lines and one with grid squares and diagonal hatching for data representation.
Summary
A newspaper editorial graphic presenting two adjacent data visualizations using grid patterns and diagonal hatching to illustrate statistical or comparative information.
Visual description
The composition shows a newspaper clipping labeled "Correio da Manhã" (a Portuguese newspaper title) containing two chart grids. The left grid is divided into seven equal vertical columns by black lines on a white background. The right grid shows a finer rectangular mesh, with the lower-right quadrant filled with diagonal purple hatching in a triangular gradient pattern. Both grids are framed with black borders in a classical editorial style. The overall design is monochromatic and highly structured, emphasizing systematic data representation.
Key takeaway
Simple geometric grids and pattern fills can effectively communicate data relationships and comparisons. The interplay of blank space and hatched regions creates visual hierarchy and guides focus.
Reuse notes
Excellent template for journalism, editorial, data journalism, or historical documentation contexts. The newspaper aesthetic conveys authority and factual reporting. The grid-based approach is timeless and scalable for various data types. Works well for economics, statistics, or scientific publications. The purple accent adds visual interest while maintaining editorial credibility.
More like this




Keep what you find
A free account saves references to boards and can send you a weekly email of picks based on what you save.
To see every result, go Pro.