Preview image. Unlock full-res
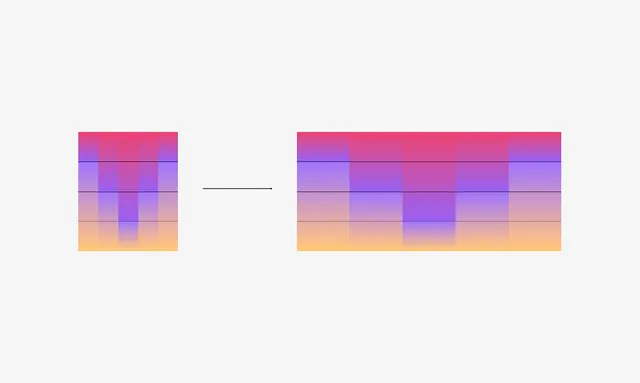
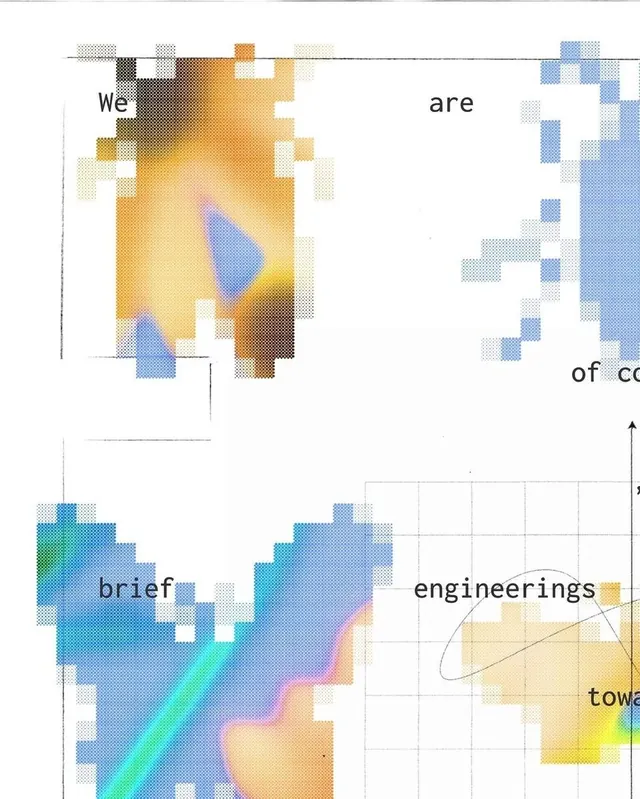
This visualization uses smooth color gradients and horizontal bars to represent a transformation or comparison between two states.
Summary
This visualization uses smooth color gradients and horizontal bars to represent a transformation or comparison between two states.
Visual description
This visualization uses smooth color gradients and horizontal bars to represent a transformation or comparison between two states. The design is clean, abstract, and relies heavily on color transitions to convey underlying data or magnitude. The composition is clean and linear, featuring two distinct parallel horizontal structures separated by a directional arrow.
Key takeaway
An ui screen reference. Worth saving for its gradient, abstract, minimalist treatment.
Reuse notes
Fits analytics work.
More like this





Keep what you find
A free account saves references to boards and can send you a weekly email of picks based on what you save.
To see every result, go Pro.