Preview image. Unlock full-res
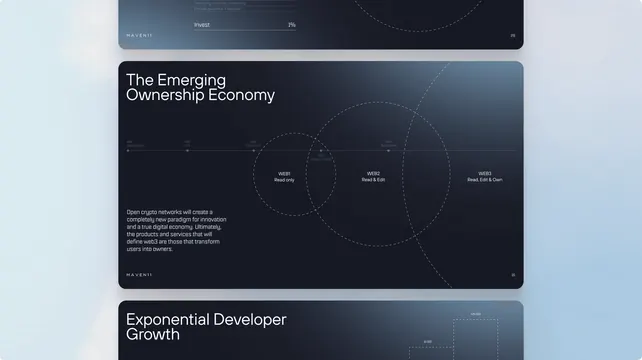
This is a scatter plot or matrix visualization displaying relationships between different technology domains (rows) and industry applications (columns).
Summary
This is a scatter plot or matrix visualization displaying relationships between different technology domains (rows) and industry applications (columns).
Visual description
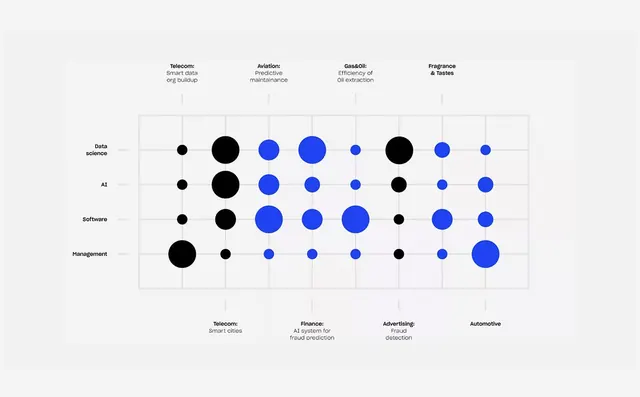
This is a scatter plot or matrix visualization displaying relationships between different technology domains (rows) and industry applications (columns). The design is clean, minimalist, and uses a simple dot pattern to convey data points across a grid structure. The chart uses a clear grid structure with distinct rows and columns to map categorical data points.
Key takeaway
A data viz reference. Worth saving for its data visualization, scatter plot, minimalist treatment.
Reuse notes
Fits fintech work.