Preview image. Unlock full-res
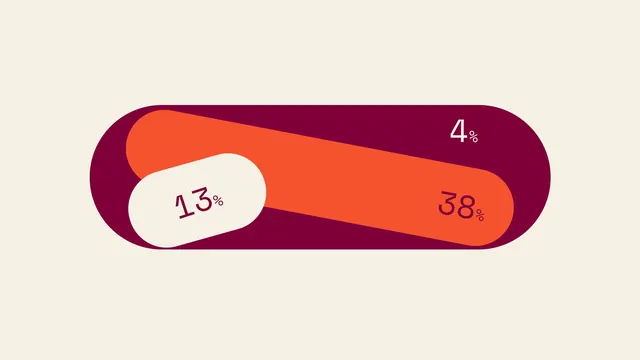
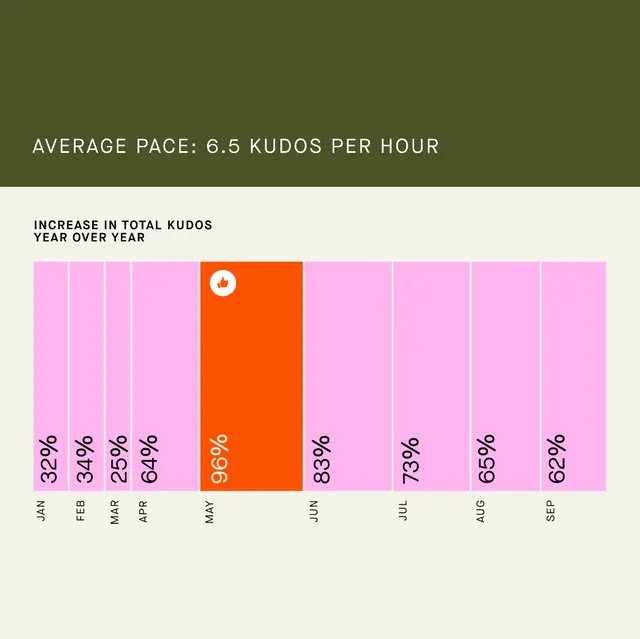
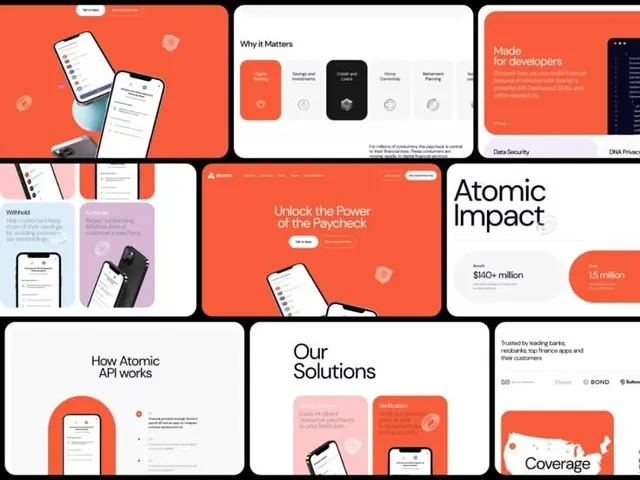
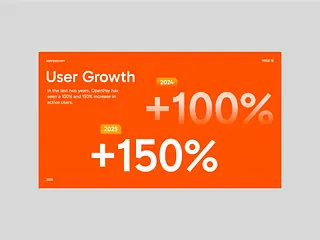
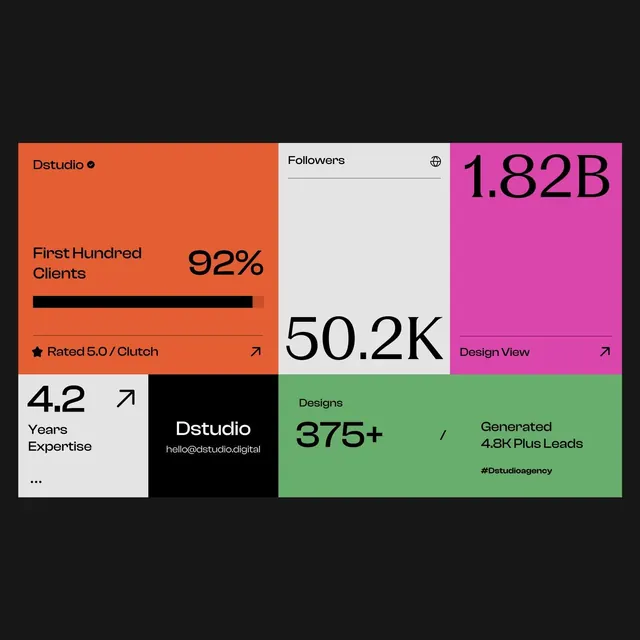
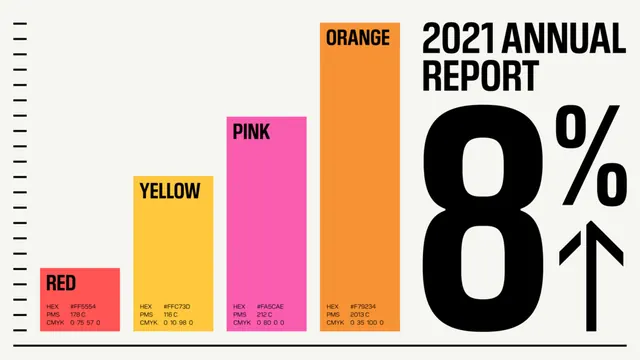
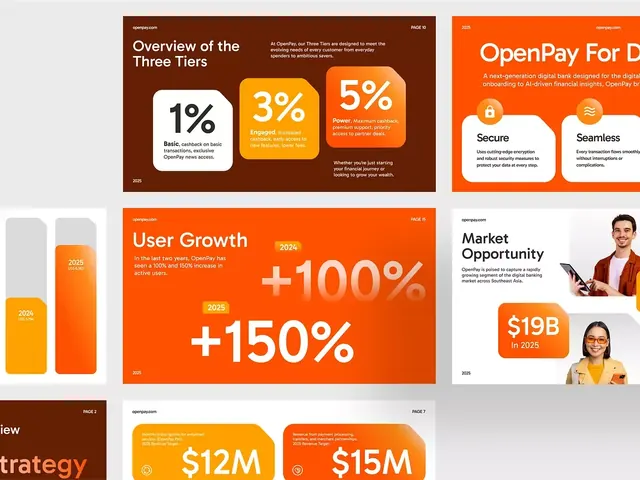
The design utilizes a bold, high-contrast visual language dominated by warm oranges and yellows to present quantitative data clearly.
Summary
The design utilizes a bold, high-contrast visual language dominated by warm oranges and yellows to present quantitative data clearly.
Visual description
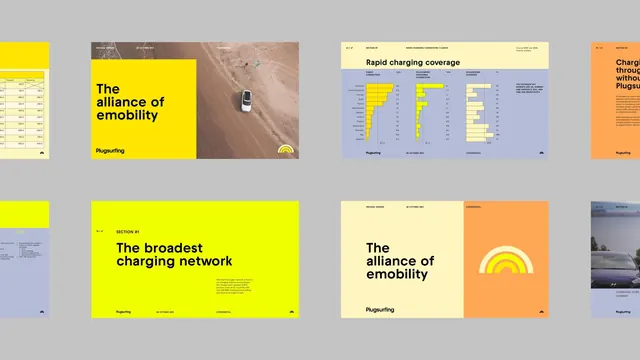
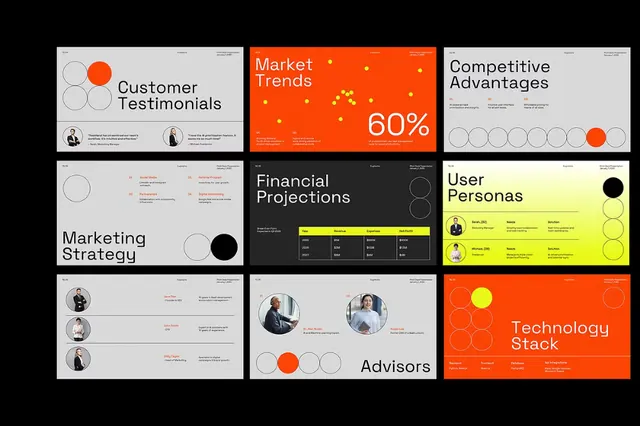
The design utilizes a bold, high-contrast visual language dominated by warm oranges and yellows to present quantitative data clearly. The style is modern and direct, focusing heavily on large numbers and clear segmentation to convey growth and opportunity effectively. The overall feel is energetic, professional, and optimistic. The slides employ a clean, modular grid structure with strong visual hierarchy to separate key metrics and concepts. Clean, bold sans-serif fonts are used throughout for maximum readability and impact.
Key takeaway
A data viz reference. Worth saving for its data visualization, flat design, high contrast treatment.
Reuse notes
Fits fintech, saas work.