Preview image. Unlock full-res
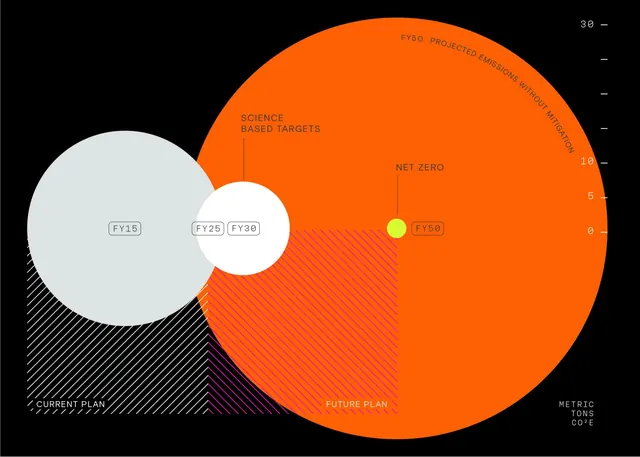
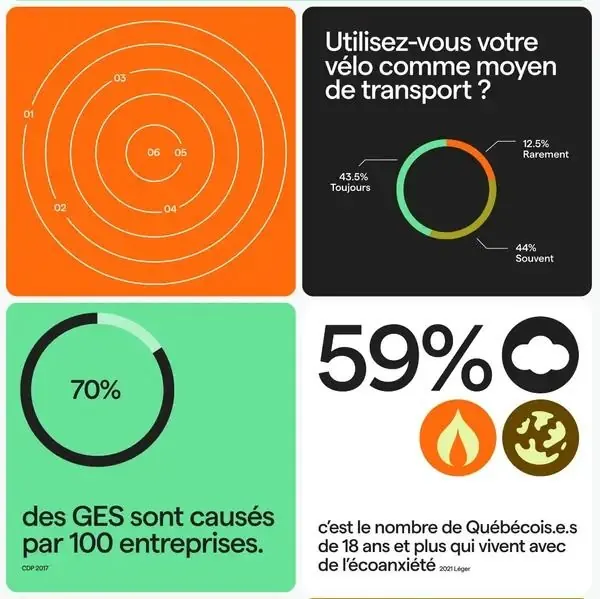
The image is a complex, circular infographic visualizing a plan or projection across different timeframes (FY15 to FY50), using a vibrant orange gradient against a dark background.
Summary
The image is a complex, circular infographic visualizing a plan or projection across different timeframes (FY15 to FY50), using a vibrant orange gradient against a dark background.
Visual description
The image is a complex, circular infographic visualizing a plan or projection across different timeframes (FY15 to FY50), using a vibrant orange gradient against a dark background. It employs a segmented, radial layout to convey progress or targets. The composition is dominated by a large, segmented circle radiating from the center, clearly separating current plans from future projections. Visible text is clean and sans-serif, typical of technical or corporate reporting.
Key takeaway
An infographic reference. Worth saving for its infographic, circular, data visualization treatment.
Reuse notes
Fits fintech work.
More like this

Keep what you find
A free account saves references to boards and can send you a weekly email of picks based on what you save.
To see every result, go Pro.