Preview image. Unlock full-res
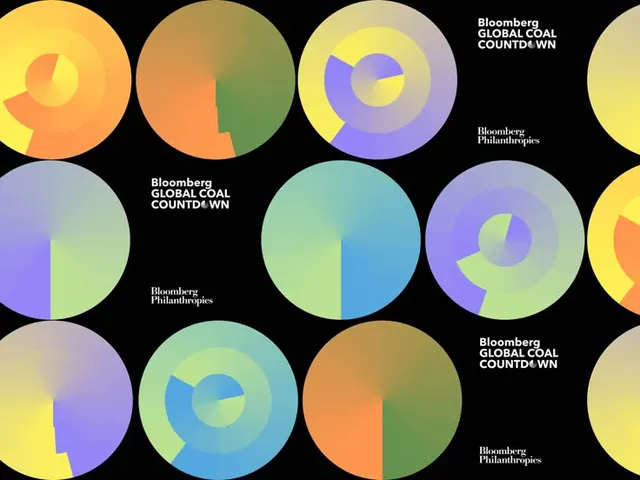
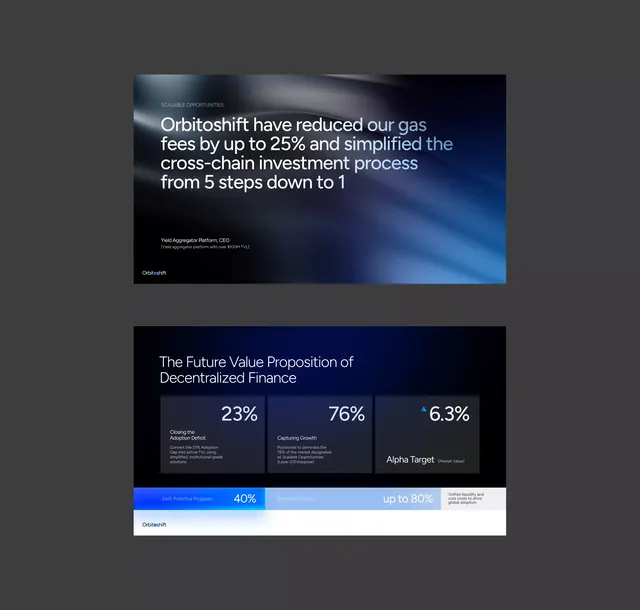
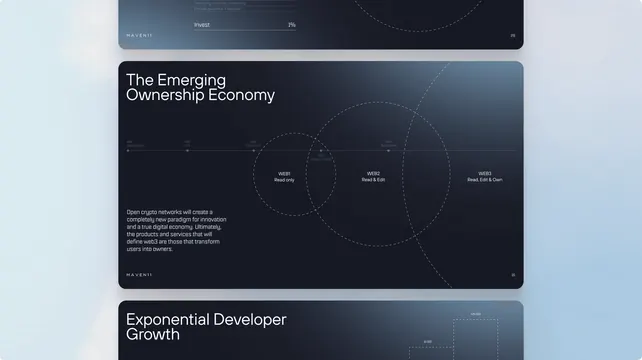
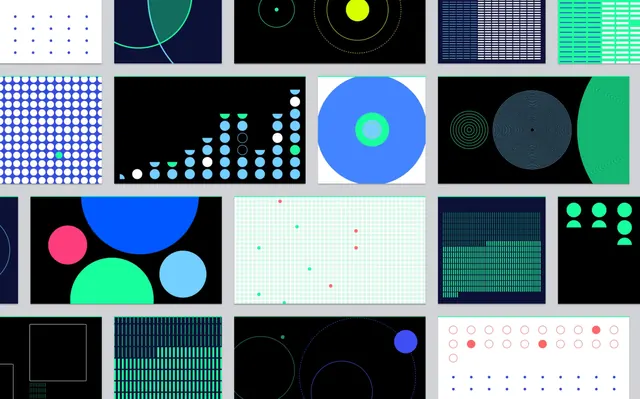
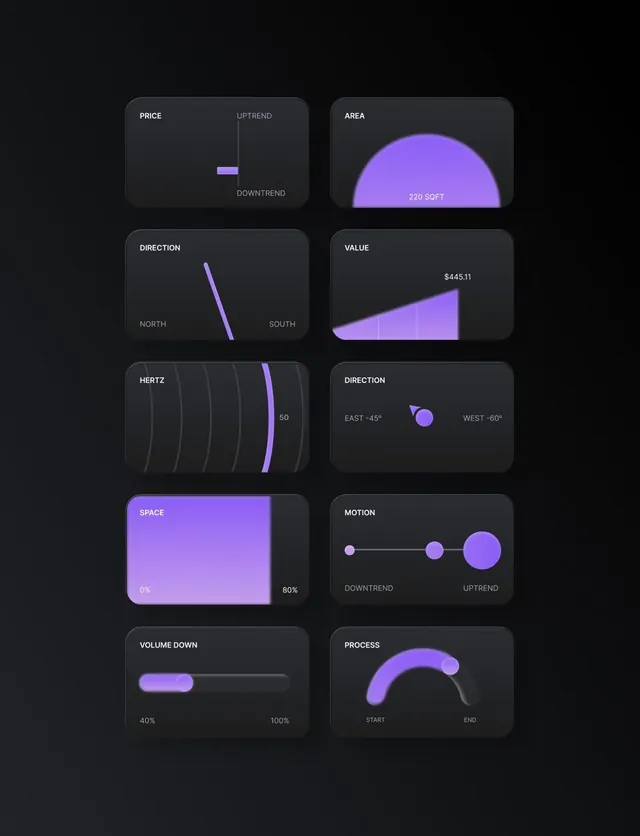
This design showcases a clean, dark-mode user interface utilizing abstract data visualizations like gauges, progress bars, and arc charts.
Summary
This design showcases a clean, dark-mode user interface utilizing abstract data visualizations like gauges, progress bars, and arc charts.
Visual description
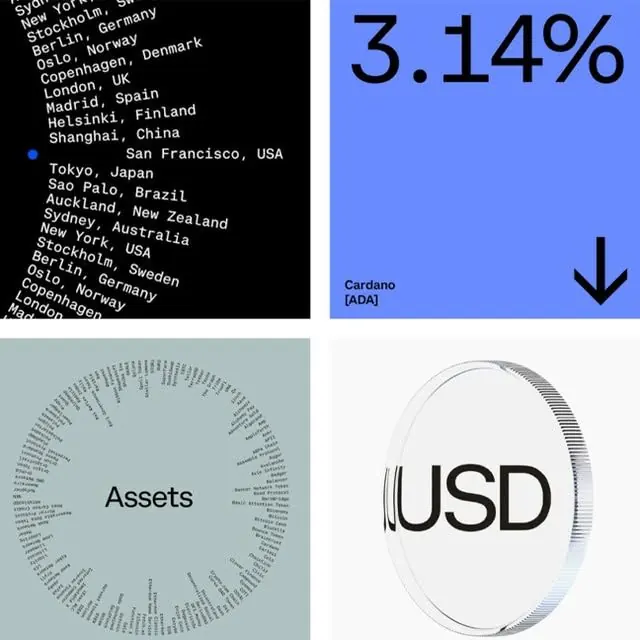
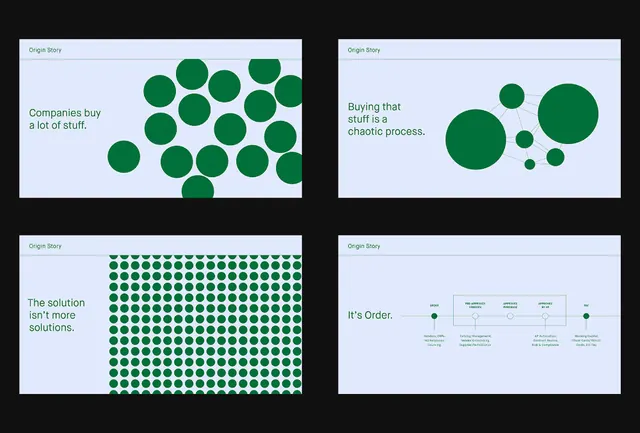
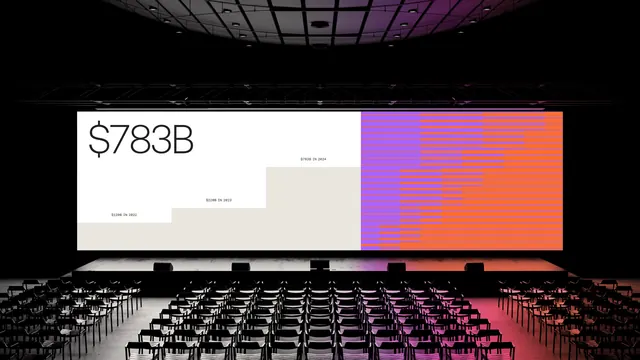
This design showcases a clean, dark-mode user interface utilizing abstract data visualizations like gauges, progress bars, and arc charts. The visual language is modern and focused on clarity, employing subtle gradients of purple to represent various metrics such as trend, value, and motion. The composition is structured as a grid of discrete panels, ensuring a clean separation and easy scanning of individual data metrics. clean sans-serif typeface is used, prioritizing legibility and a modern technological feel.
Key takeaway
A data viz reference. Worth saving for its minimalist, dark mode, data visualization treatment.
Reuse notes
Fits fintech work.