Preview image. Unlock full-res
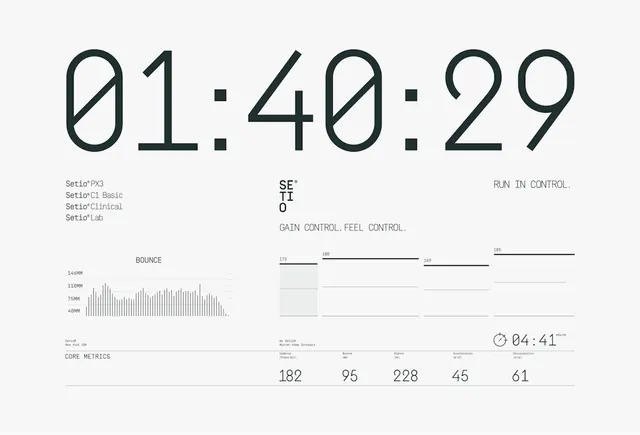
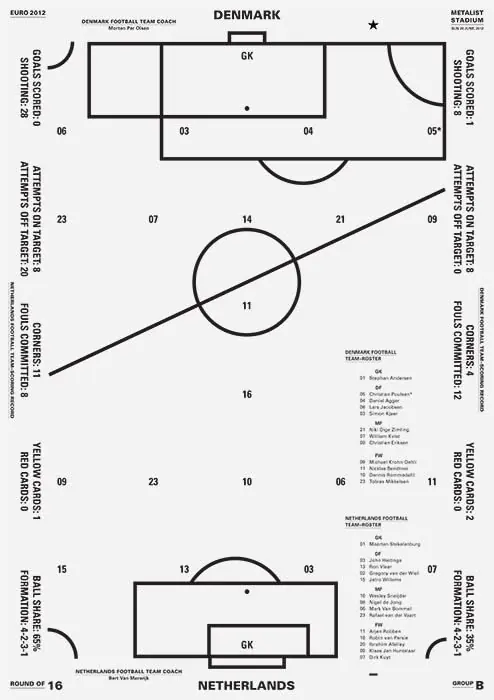
This is a highly functional and technical data visualization used for tracking sports statistics.
Summary
This is a highly functional and technical data visualization used for tracking sports statistics.
Visual description
This is a highly functional and technical data visualization used for tracking sports statistics. The design relies on precise line work, geometric shapes, and clear labeling to convey complex information in a schematic manner. The composition is structured as a clear diagram, using internal lines and demarcated zones to organize statistical data logically. Clear, legible sans-serif fonts are used throughout to ensure readability of numerical data.
Key takeaway
A data viz reference. Worth saving for its schematic, line art, data visualization treatment.
Reuse notes
Fits general design work.