Preview image. Unlock full-res
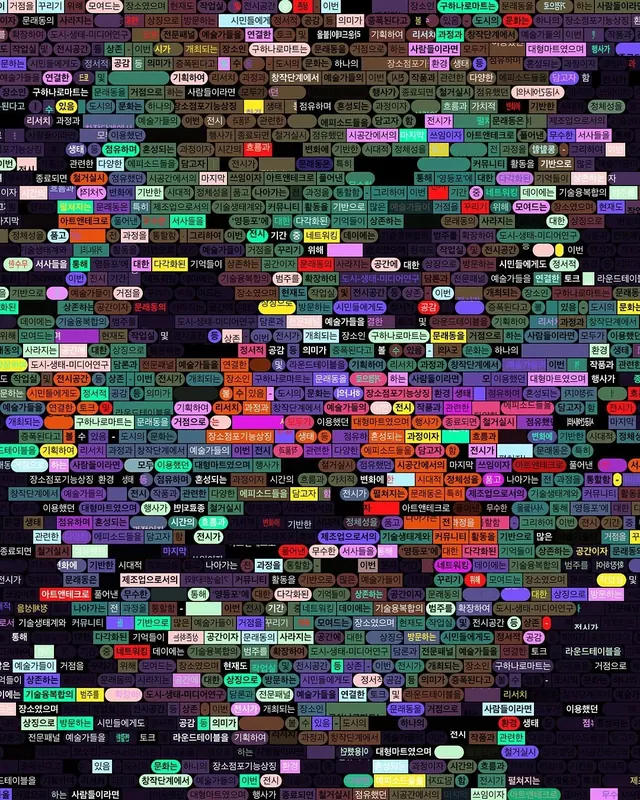
Complex information visualization densely packed with colorful tagged text labels in Korean, creating a mosaic-like composition with varied background colors.

Summary
A densely packed data visualization featuring hundreds of Korean-language labels organized in a grid with distinct colored background cells, creating a comprehensive taxonomy or classification system.
Visual description
The entire composition is filled with white and light text on color-blocked backgrounds. Labels range from small to medium sizes. Colors include bright magenta, cyan, yellow, green, orange, purple, and neutral tones. Each label appears to be categorized or tagged within its own colored cell. Text density is extremely high, covering nearly every pixel of the canvas. The overall effect is an intense, information-rich mosaic.
Key takeaway
The color-coding system creates visual hierarchy and category distinction within extremely dense information. The consistent application of boxed labels with colored backgrounds makes the complex data navigable despite extreme density.
Reuse notes
Reference for information architecture, knowledge mapping, or classification system design. The approach works for academic, technical, or reference contexts where comprehensive categorization is required.
More like this
Keep what you find
A free account saves references to boards and can send you a weekly email of picks based on what you save.
To see every result, go Pro.