Preview image. Unlock full-res
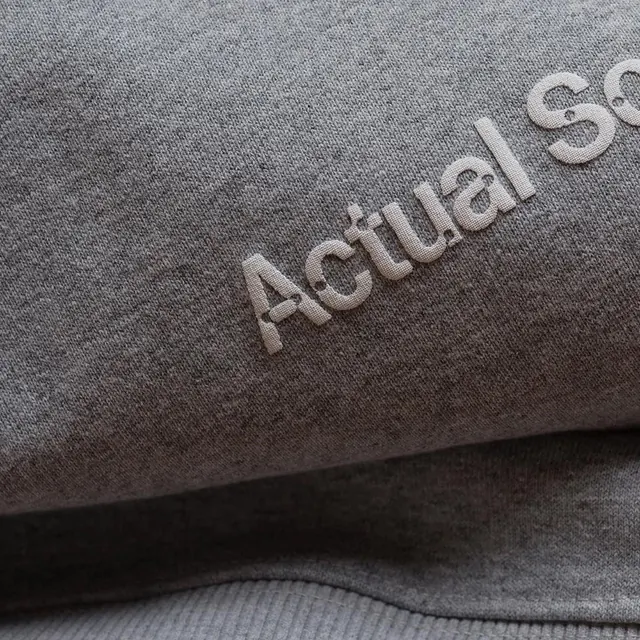
Macro photograph of gray heather sweatshirt fabric with cream-colored embroidered lettering, capturing texture and stitching detail.

Summary
A macro close-up photograph of gray heather-textured sweatshirt fabric with cream-colored embroidered lettering visible in the upper right corner, showcasing textile detail and stitching craftsmanship.
Visual description
The image captures a shallow-depth macro shot of knit fabric in medium gray. Embroidered text in cream/off-white runs diagonally across the right portion of the frame (text appears to read "Actual So..." with the remainder cropped out). The embroidery stitching is clearly visible against the fine woven texture of the garment. Soft studio lighting emphasizes the fabric weave and thread detail. A folded edge of the garment appears at the lower edge of the frame. The overall tone is warm and neutral, with subtle color variation in the fabric itself.
Key takeaway
Effective close-up product photography that highlights craft details (embroidery, stitching, fabric texture) through macro depth-of-field and controlled lighting. The angled text placement draws the eye while the shallow focus keeps emphasis on the textile work.
Reuse notes
Strong reference for apparel product photography, particularly for showcasing embroidery, custom stitching, or fabric detail. The macro approach and warm lighting work well for communicating premium or handcrafted quality. Angled composition creates visual interest without feeling forced.
More like this








Keep what you find
A free account saves references to boards and can send you a weekly email of picks based on what you save.
To see every result, go Pro.