Preview image. Unlock full-res
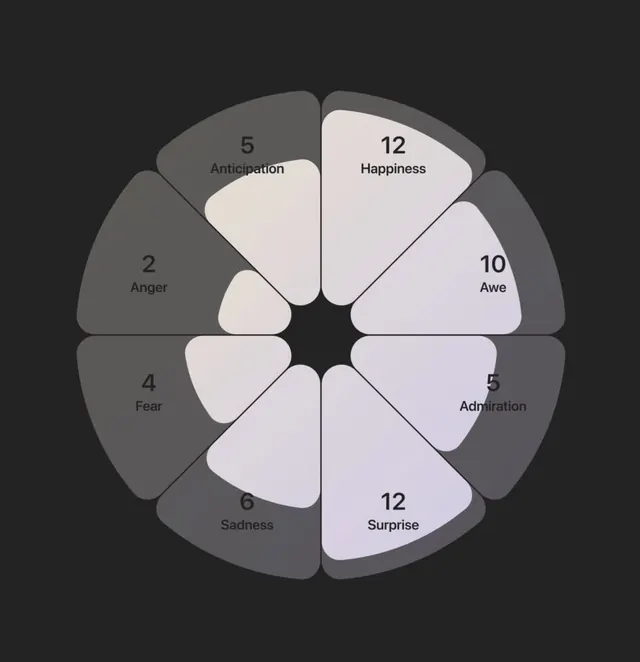
A circular infographic depicting various human emotions with corresponding numerical values and labels.
Summary
A circular infographic depicting various human emotions with corresponding numerical values and labels.
Visual description
A segmented circular chart on a black background featuring grayscale shades. Each segment contains a number, an emotion label (e.g., Happiness, Anger, Sadness), and a distinct gray value.
Key takeaway
The design uses a clean, segmented wheel to categorize and quantify qualitative emotional data.
Reuse notes
Use as a template for data visualization projects requiring the mapping of qualitative categories to quantitative values.
More like this



Keep what you find
A free account saves references to boards and can send you a weekly email of picks based on what you save.
To see every result, go Pro.