Preview image. Unlock full-res
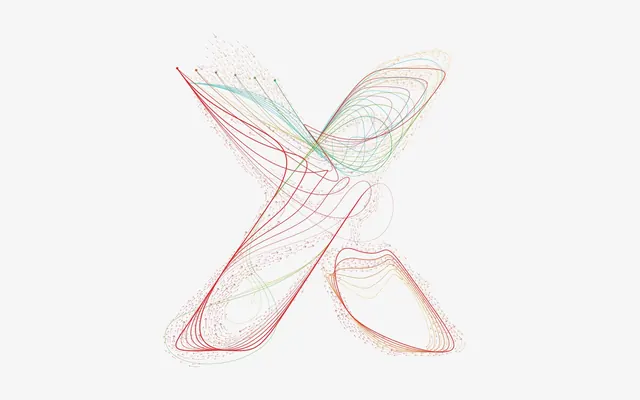
Generative or mathematical visualization of flowing curves and lines in multiple colors (red, green, blue, orange) on a light background.
Summary
Abstract mathematical visualization resembling flow fields, particle systems, or generative algorithms. Symmetrical composition with organic curves radiating from center points. Multiple color channels (red, green, blue, orange) create visual separation of data layers.
Visual description
Centered composition on light background. Multiple flowing curves and linear elements arranged in roughly symmetrical pattern. Red curved lines on left side flowing toward center, with scattered particles. Blue curved lines on right side creating wing or petal-like forms. Green and orange accents throughout. Dense linear regions create texture, while sparse areas show breathing room. Appears organic/natural despite mathematical origin.
Key takeaway
Abstract technical visualization as aesthetic object: complex data or algorithms can be beautiful without immediate legibility. Symmetric composition and color differentiation create visual interest and suggest information hierarchy.
Reuse notes
Tech company branding, science/research communications, generative art contexts, mathematics/coding portfolios. Works as background or standalone illustration. Conveys innovation, complexity, and sophistication without specific domain knowledge required.