Preview image. Unlock full-res
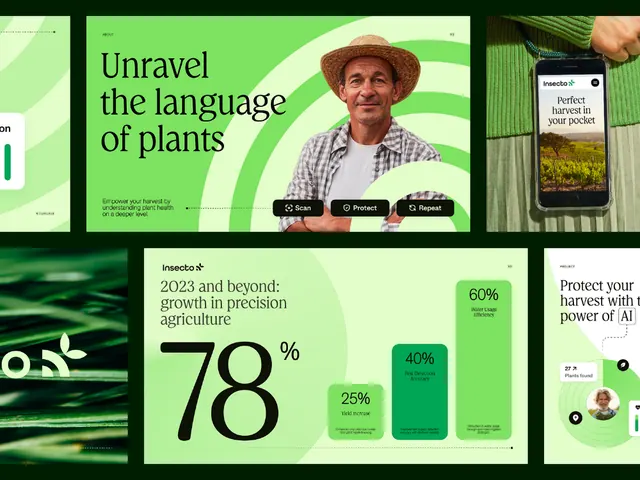
A vibrant green-and-white infographic grid showcasing agricultural-technology statistics and imagery with a portrait of a farmer.
Summary
A minimal grid-based infographic presenting agricultural-technology metrics in vibrant lime green, combining hero photography of a farmer, statistics, and stylized plant imagery.
Visual description
The layout divides into modular cards: the top-left features a farmer in a brown hat and shirt against a bright-green background with the tagline "Unravel the language of plants." Stat cards display bold percentages and growth indicators in bright lime green and dark forest green against white or green backgrounds. A bar-chart visualization shows relative metrics. Plant illustrations and leaf photography appear as accent imagery. All text uses clean sans-serif fonts in white, dark green, or lime green. The palette alternates white backgrounds with solid bright-green fields, creating a crisp, digital-native appearance. The composition reads as a modular dashboard or landing-page hero section designed to convey innovation in agricultural tech through color and clean hierarchy.
Key takeaway
The vibrant, single-color palette (bright green) conveys growth and nature while remaining modern and tech-forward. The grid layout with modular cards allows flexible arrangement of stats, photography, and illustrations. Large sans-serif type on colored backgrounds creates quick visual scanning. The pairing of human portraiture (the farmer) with data humanizes technology in the agricultural space.
Reuse notes
Ideal for agritech SaaS, agricultural platforms, or any sustainability-focused product needing to convey innovation, trust, and growth. The bright-green + white palette works well for environmental or health-tech brands. Works as a landing-page hero, infographic poster, or data-visualization dashboard. Requires strong supporting photography (portraits, plant close-ups) to anchor the grid. Scale well to print or digital formats.
More like this

Keep what you find
A free account saves references to boards and can send you a weekly email of picks based on what you save.
To see every result, go Pro.