Preview image. Unlock full-res
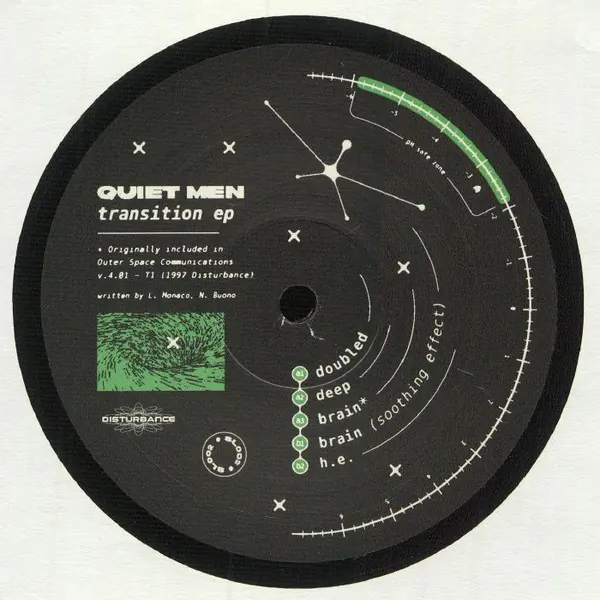
Concentric circular diagram with labeled frequency rings and geometric nodes on a black background with green accents, resembling an audio or sound-wave visualization.
Summary
Circular infographic showing concentric frequency rings with labeled nodes and geometric elements on black, suggesting audio or sonic data visualization.
Visual description
Centered radial diagram on pure black background. Multiple concentric circular rings with radiating white lines and labeled data points arranged at cardinal and intercardinal positions. Muted sage-green accent color highlights specific nodes and segments. Sans-serif labels sit at cardinal points. Overall composition is tightly centered and symmetrical, evoking technical precision and minimal ornamentation.
Key takeaway
The minimal radial-data approach: concentric circles and spoke geometry are immediately legible and avoid heavy illustration. Green highlights against monochrome backgrounds draw focus efficiently. The centered, card-like square composition suits digital UI and print equally.
Reuse notes
Ideal for data dashboards, audio interfaces, technical documentation, and scientific infographics. Works well when the audience expects precision and depth. The black background demands careful contrast for any added text or UI elements layered on top.
More like this










Keep what you find
A free account saves references to boards and can send you a weekly email of picks based on what you save.
To see every result, go Pro.