Preview image. Unlock full-res
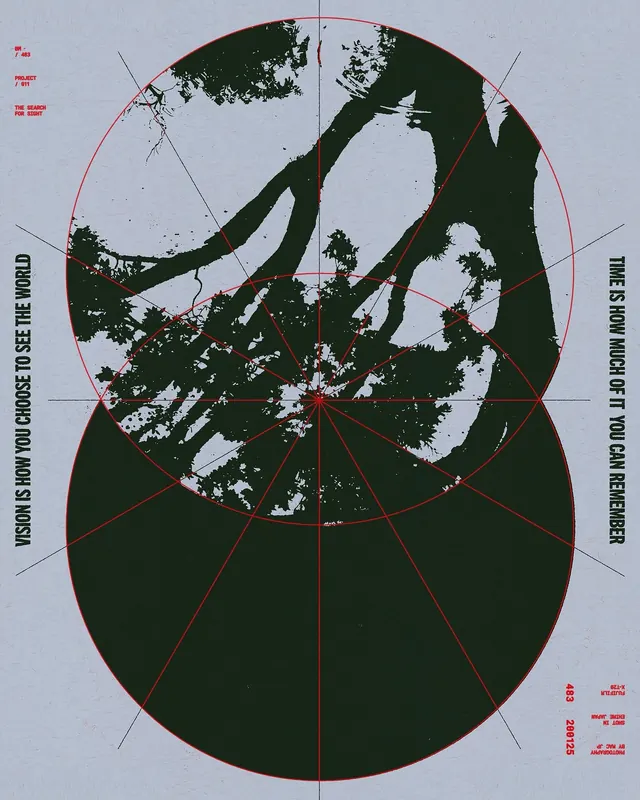
A circular infographic or data visualization featuring a dark, organic-shaped landmass or network structure set against a grid of red lines and coordinates.

Summary
A circular infographic or data visualization featuring a dark, organic-shaped landmass or network structure set against a grid of red lines and coordinates.
Visual description
A circular graphic with a dark, irregular shape resembling a landmass or neural network. It is overlaid with a red coordinate grid and small text labels along the perimeter.
Key takeaway
The design effectively combines organic shapes with rigid technical elements to convey complex data or geographical information.
Reuse notes
Can be used as a background element for data-heavy dashboards or as a conceptual graphic for tech-focused branding.
More like this


Keep what you find
A free account saves references to boards and can send you a weekly email of picks based on what you save.
To see every result, go Pro.