Preview image. Unlock full-res
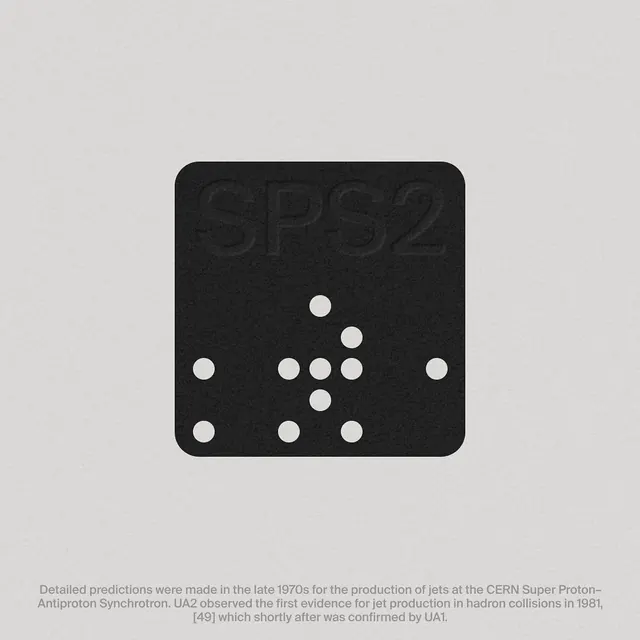
A minimalist graphic featuring a dark square containing the embossed text 'SPS2' and a scattered pattern of white dots, accompanied by explanatory text below.
Summary
A minimalist graphic featuring a dark square containing the embossed text 'SPS2' and a scattered pattern of white dots, accompanied by explanatory text below.
Visual description
A dark, rounded-corner square contains the embossed text 'SPS2' at the top and a scattered arrangement of white circular dots below. The composition is centered on a light gray textured background with a block of small sans-serif text at the bottom.
Key takeaway
Use high-contrast, geometric dot patterns to represent complex data sets in a minimalist, abstract way.
Reuse notes
Ideal for scientific presentations, technical branding, or data-driven editorial illustrations.
More like this






Keep what you find
A free account saves references to boards and can send you a weekly email of picks based on what you save.
To see every result, go Pro.