Preview image. Unlock full-res
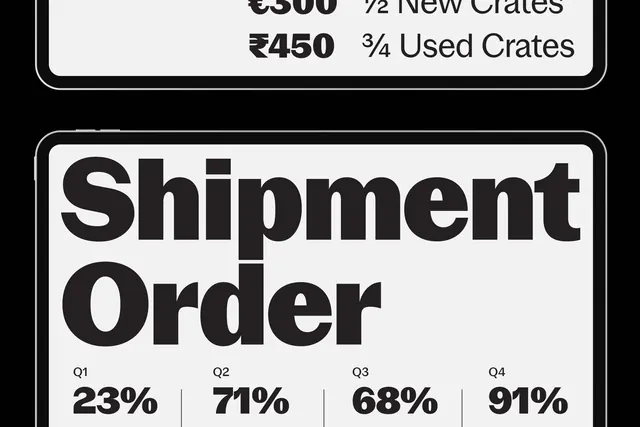
A high-contrast data visualization showing shipment status percentages and pricing for crates.
Colormonochrome, dark, light
Typesans-serif, oversized
Moodprofessional, technical, bold
Palette
#EDEDED
#141214
Summary
A high-contrast data visualization showing shipment status percentages and pricing for crates.
Visual description
A black and white layout featuring a large 'Shipment Order' header above four data points (Q1-Q4) with percentages. Above this, a pricing table lists costs for new and used crates.
Key takeaway
Uses bold typography and a grid-based layout to communicate complex logistics data clearly.
Reuse notes
Apply this high-contrast, boxed layout for dashboard metrics or pricing tables.
More like this

Keep what you find
A free account saves references to boards and can send you a weekly email of picks based on what you save.
To see every result, go Pro.