Preview image. Unlock full-res
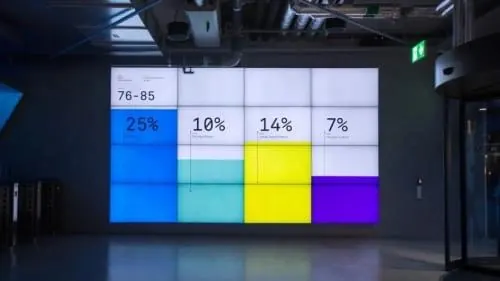
A large-scale physical data visualization featuring four colored blocks with corresponding percentages and a numerical range.
Summary
A large-scale physical data visualization featuring four colored blocks with corresponding percentages and a numerical range.
Visual description
A large wall display divided into four vertical rectangular blocks in blue, cyan, yellow, and purple. Each block contains a percentage (25%, 10%, 14%, 7%) and a top header showing a numerical range of 76-85.
Key takeaway
Uses high-contrast color blocking and clear typography to communicate complex data points in a physical space.
Reuse notes
Apply the color-coded block system to dashboard UI elements or physical signage for data reporting.
More like this


Keep what you find
A free account saves references to boards and can send you a weekly email of picks based on what you save.
To see every result, go Pro.