Preview image. Unlock full-res
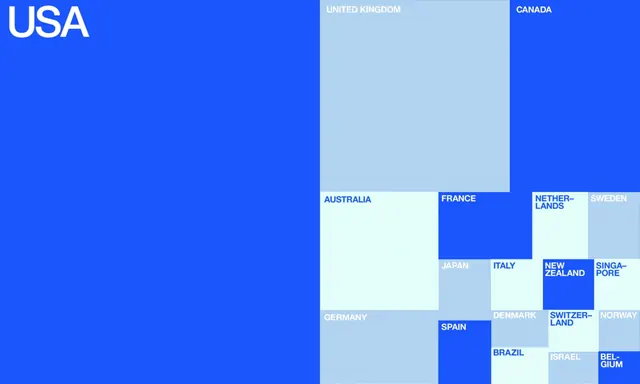
A geometric, grid-based map visualization highlighting the USA and various international countries using solid color blocks.
Summary
A geometric, grid-based map visualization highlighting the USA and various international countries using solid color blocks.
Visual description
A large blue rectangle represents the USA with white text. To the right, a grid of smaller rectangles represents other countries in light blue and dark blue.
Key takeaway
Uses a modular grid system to represent geographic data through simplified geometric shapes.
Reuse notes
Can be used as a template for regional data distribution or global reach infographics.
More like this




Keep what you find
A free account saves references to boards and can send you a weekly email of picks based on what you save.
To see every result, go Pro.