Preview image. Unlock full-res
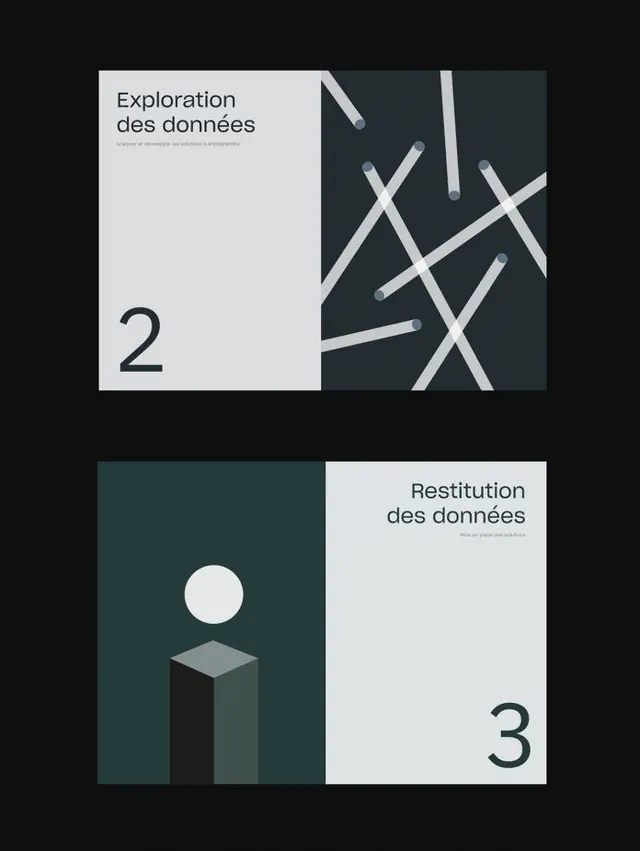
Two-slide sequence for data visualization using split-panel layout: left side text and diagrams, right side 3D geometric shapes representing data states.
Summary
Presentation slides demonstrating data exploration and restitution using split-panel composition, numbered French headings, and abstract geometric elements.
Visual description
Slide 2 (top): Left panel light gray with "Exploration des donnees" headline and numbered "2". Right panel dark teal-blue with crossed diagonal white lines forming an X-pattern, suggesting data intersections or network flow. Slide 3 (bottom): Left panel dark teal with a white circle, gray diamond, and black cube in isometric view, representing abstract data objects. Right panel light gray with "Restitution des donnees" headline and numbered "3". All panels use clean sans-serif type in dark gray, with generous whitespace. The palette is strictly limited to off-white, teal-blue, dark gray, and black, creating high contrast without color vibration.
Key takeaway
The split-panel symmetry makes complex information scannable; the geometric abstraction (X-lines, isometric shapes) communicates process or transformation without literal imagery; numbered slides and French labeling suggest a structured, formal narrative flow.
Reuse notes
Ideal for business or scientific presentations needing data methodology explanation. The teal accent on dark grounds gives understated visual interest without corporate cliche. Works best when paired with data-specific diagrams or charts. The abstraction can feel cold; pair with warm typography or imagery if audience tone needs approachability.
More like this


Keep what you find
A free account saves references to boards and can send you a weekly email of picks based on what you save.
To see every result, go Pro.