Preview image. Unlock full-res
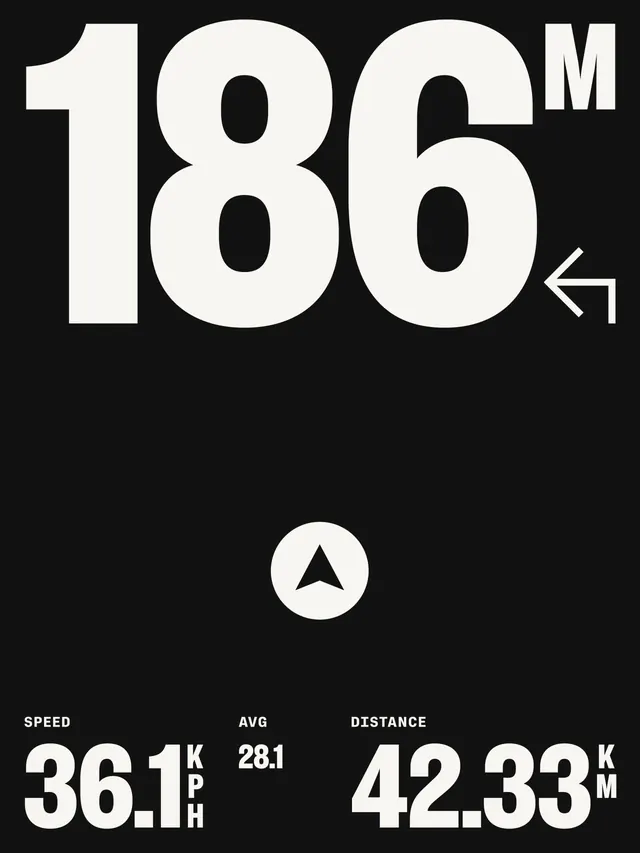
A dark cycling analytics interface displaying ride statistics with large typography showing distance and speed metrics.
Summary
A minimalist cycling performance dashboard displaying ride metrics with large bold typography showing a distance of 186 meters, speed of 36.1 kph, and average gradient of 28.1 percent.
Visual description
Black background with white typography and minimal iconography. Large bold sans-serif numerals display 186M at the top right with a superscript M. A small white circle with an upward-pointing triangle (compass/direction indicator) sits in the center. Below, three metrics are left-aligned in white text: SPEED (36.1 KPH), AVG (28.1), and DISTANCE (42.33 KM). A small left-pointing arrow icon appears near the top right. The layout is clean and information-hierarchical, with metric labels in smaller caps above values.
Key takeaway
The bold oversized primary metric (186M) creates immediate visual hierarchy while supporting metrics remain accessible below. The dark background and high contrast make data instantly readable even in bright outdoor conditions.
Reuse notes
Excellent reference for fitness tracking applications, cycling computers, or athletic performance dashboards. The typography-driven approach works well for real-time data display where clarity is critical. Good model for any application needing to present multiple related metrics in a scannable format.