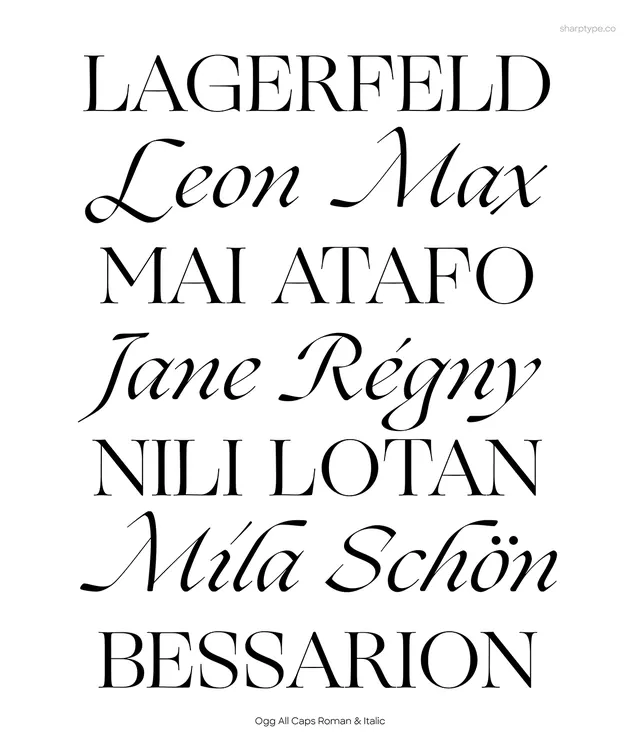
Preview image. Unlock full-res
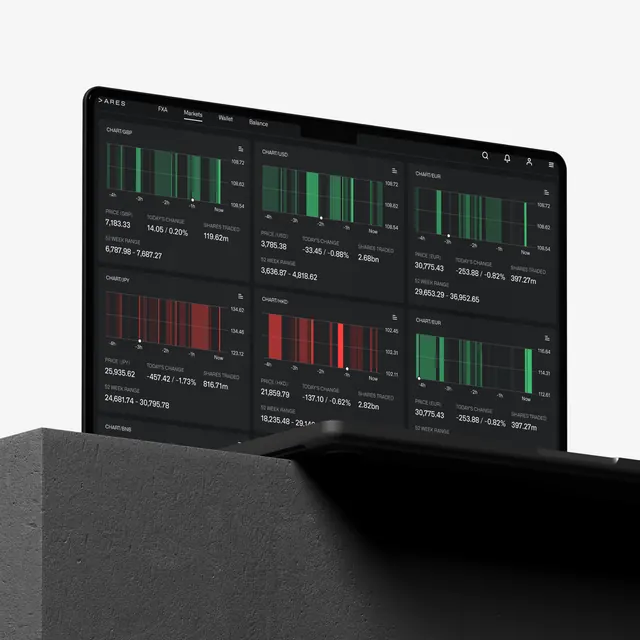
A high-fidelity UI design for a data-driven dashboard featuring dark mode aesthetics and complex information visualization.
Summary
A high-fidelity UI design for a data-driven dashboard featuring dark mode aesthetics and complex information visualization.
Visual description
The interface features a deep black background with vibrant blue and white data points. It includes various charts, line graphs, and modular widgets organized in a grid layout.
Key takeaway
Utilizes high-contrast elements and a structured grid to make complex data easily digestible in a dark environment.
Reuse notes
Can be used as a reference for layout hierarchy and color contrast in enterprise software design.
More like this
Keep what you find
A free account saves references to boards and can send you a weekly email of picks based on what you save.
To see every result, go Pro.