Preview image. Unlock full-res
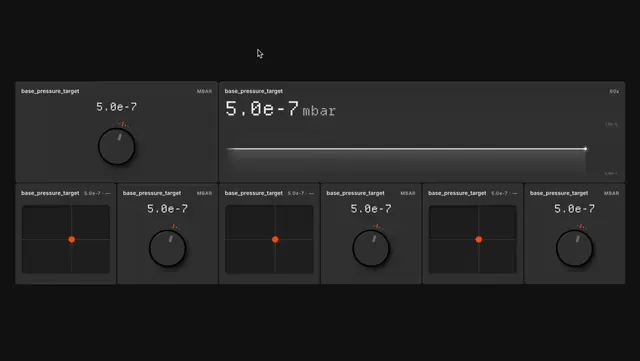
A dark, data-dense instrument control interface for monitoring vacuum pressure readings, featuring rotary knobs, live waveform graphs, and scientific notation readouts across multiple parameter.
More like this
See all
Summary
A dark, data-dense instrument control interface for monitoring vacuum pressure readings, featuring rotary knobs, live waveform graphs, and scientific notation readouts across multiple parameter.
Visual description
A scientific instrument dashboard displays hierarchical data with a prominent two-panel layout at the top showing a rotary knob control and waveform trend graph side-by-side, each reading 5.0e-7 mbar. Below, six smaller monitoring units maintain visual rhythm through consistent framing and identical component placement, each combining a smaller rotary dial with compressed gauges and numerical readouts. The dark gray palette and subtle borders create clear visual separation without overwhelming density.
Key takeaway
Repeating the rotary knob and gauge pattern at different scales establishes visual consistency across a data-heavy interface, allowing users to quickly scan and compare similar parameters without cognitive load.
Reuse notes
Reach for this as a ui screen reference. Pairs with minimal, high contrast directions. Original by Seb Cornelius.