Preview image. Unlock full-res
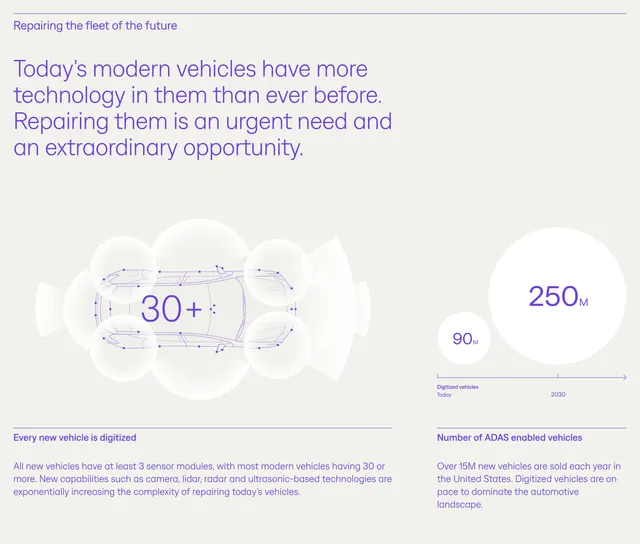
Purple-on-cream problem section with sensor wireframe car graphic and ADAS vehicle growth bubble chart.
Summary
Problem framing on vehicle tech complexity with top-down sensor map labeled 30+ and a 90M-to-250M ADAS growth timeline.
Visual description
Off-white field. Purple eyebrow "Repairing the fleet of the future" and large purple headline on urgent repair need. Two columns separated by rules: left purple wireframe car with translucent sensor cones and central "30+" with subhead on digitized vehicles; right bubble chart 90M today vs 250M by 2030 on purple timeline axis with ADAS enabled vehicles copy below.
Key takeaway
Pairing micro technical diagram with macro market bubbles tells both product and TAM stories in one band. Monochrome purple graphics stay on-brand on cream paper.
Reuse notes
Deep-tech companies explaining why now. Illustrations must be accurate; bubble chart needs cited data. Works above product sections.