Preview image. Unlock full-res
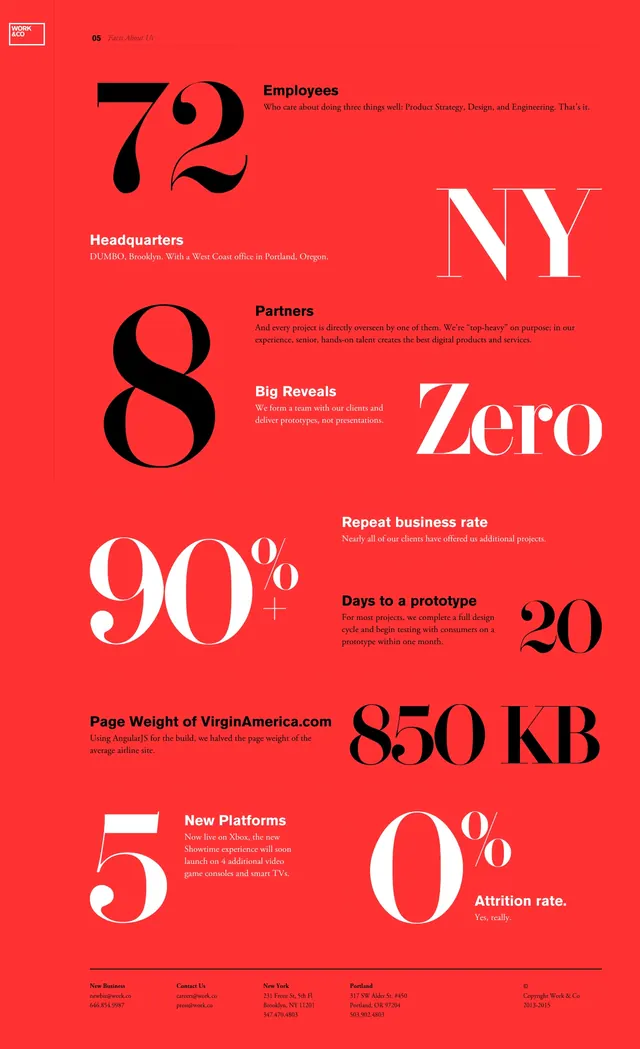
A vibrant red poster displaying company statistics and metrics in bold white and black typography with clear information hierarchy.
Summary
A bold red infographic poster presenting company metrics through oversized white numbers and black descriptive text in a clean grid layout.
Visual description
A bright red background holds a collection of statistics arranged in a modular grid. Large white numerals and text elements dominate the layout, representing key metrics like employee count, headquarters location, revenue, and business rates. Smaller black body text provides context and definition for each statistic. The design uses generous white space between elements. Typography is sans-serif and bold, creating strong visual contrast against the red background. Minimal embellishment keeps focus on the data.
Key takeaway
Information design doesn't require complex visualization. Bold typography and numeric hierarchy can effectively communicate data. The single bold background color unifies disparate statistics and creates visual impact.
Reuse notes
Perfect for: corporate presentations, company factsheets, investor relations materials, data-driven reporting, annual reports. The bold red and white palette stands out on print and screen. The modular grid approach scales well to different data sets. Clean typography ensures legibility at any size. Works well in B2B contexts where data credibility matters.