Preview image. Unlock full-res
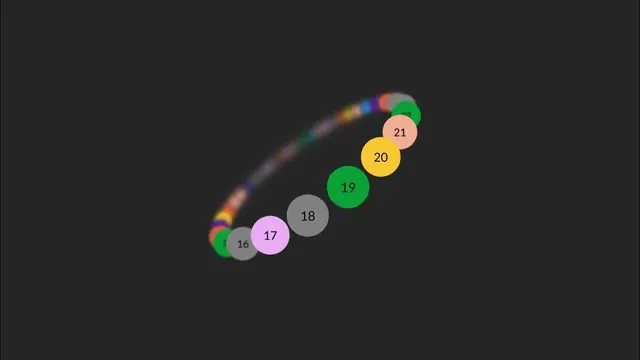
A dark data-viz still where numbered color-coded circles of varying size follow an ascending curved path, trailing into a blurred rainbow stream.
Summary
A dark data-visualization still showing numbered, color-coded circles of differing sizes strung along an ascending curve, with earlier points compressed into a blurred rainbow trail.
Visual description
On a near-black background, a row of solid circles follows a curving path that dips low then rises to the right. Each circle carries a dark two-digit numeral (16 through 22) in a plain sans-serif and is filled a distinct flat color: grey, lilac, green, gold, and pale peach among them. Circle size varies from point to point, hinting at a magnitude encoding. To the upper left the sequence collapses into a soft, motion-blurred streak of overlapping colors, reading as the earlier, faster part of the path. The rest of the frame is empty dark space.
Key takeaway
Encoding an ordered sequence as numbered bubbles on a freeform curve, with size doing double duty as a second variable, and letting the tail blur into a colored streak to imply time and speed.
Reuse notes
A good reference for animated or timeline-style bubble charts in analytics and data storytelling. The motion trail only reads on a dark ground. Numerals must stay legible against saturated fills, so keep type dark on light circles.